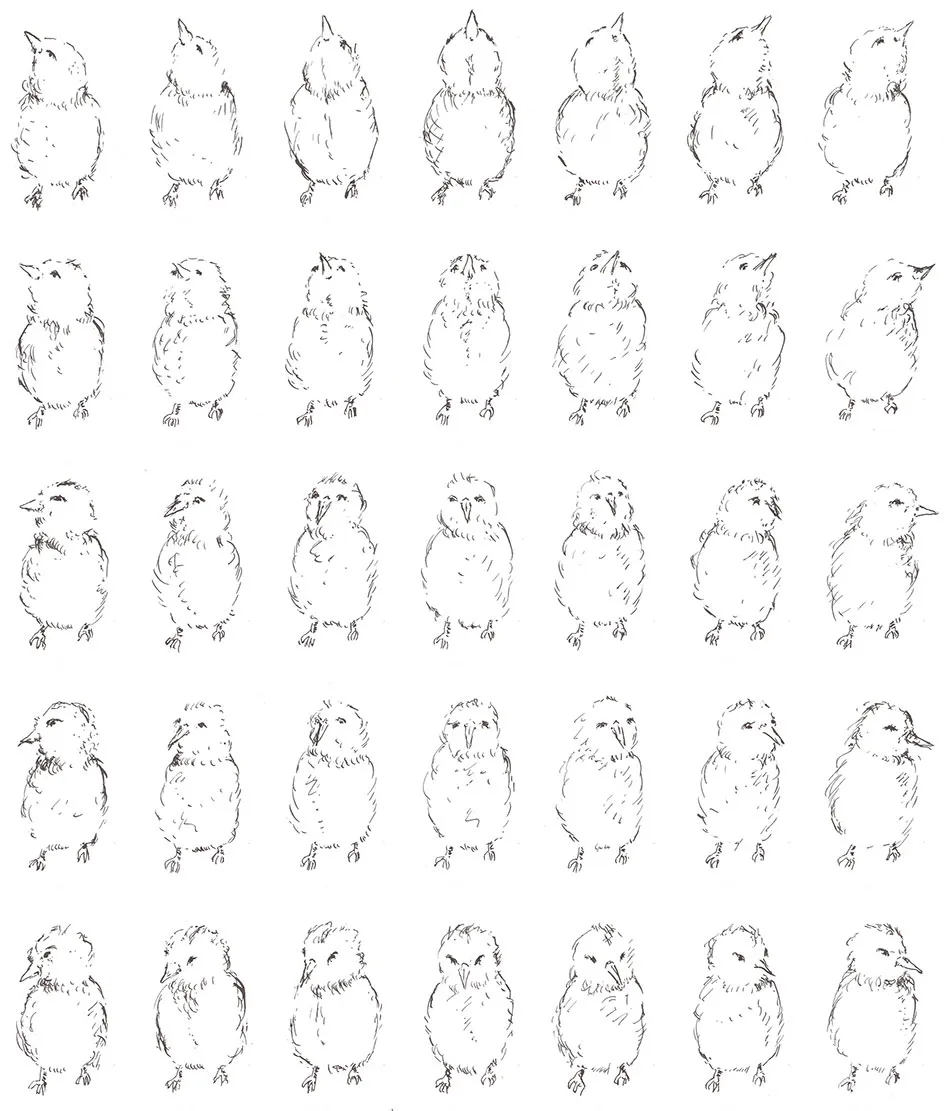
Vista al mar

Saturday, November 11, 2017

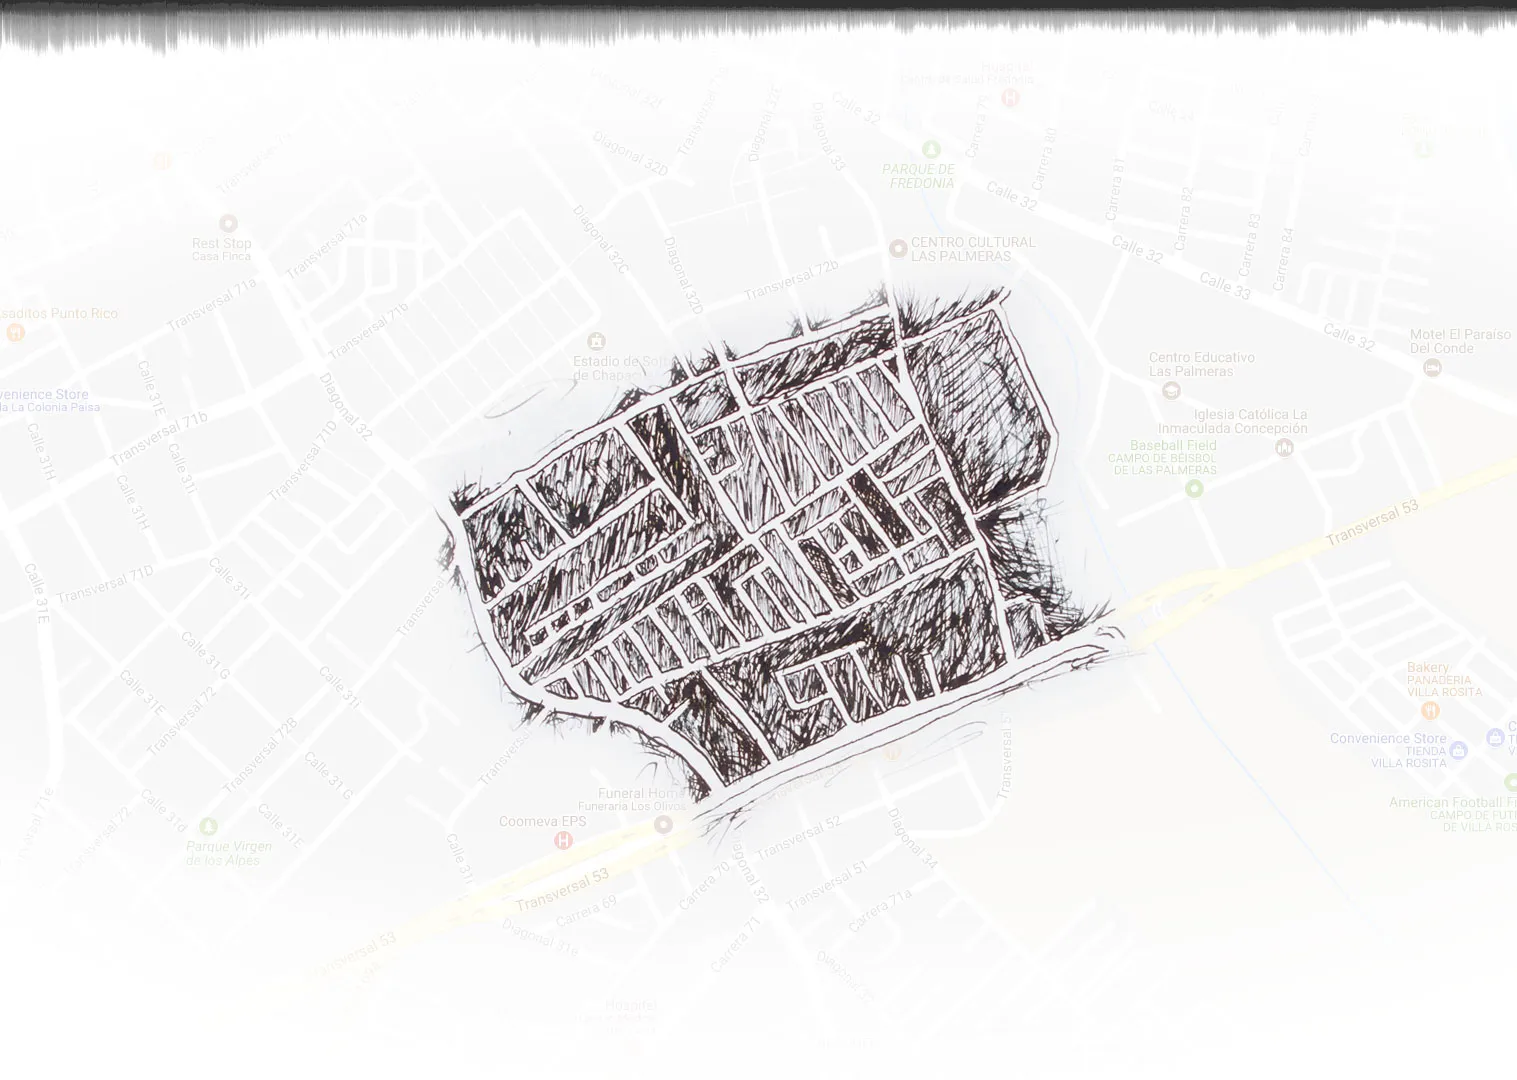
Dibujo Defunciones

Saturday, November 11, 2017

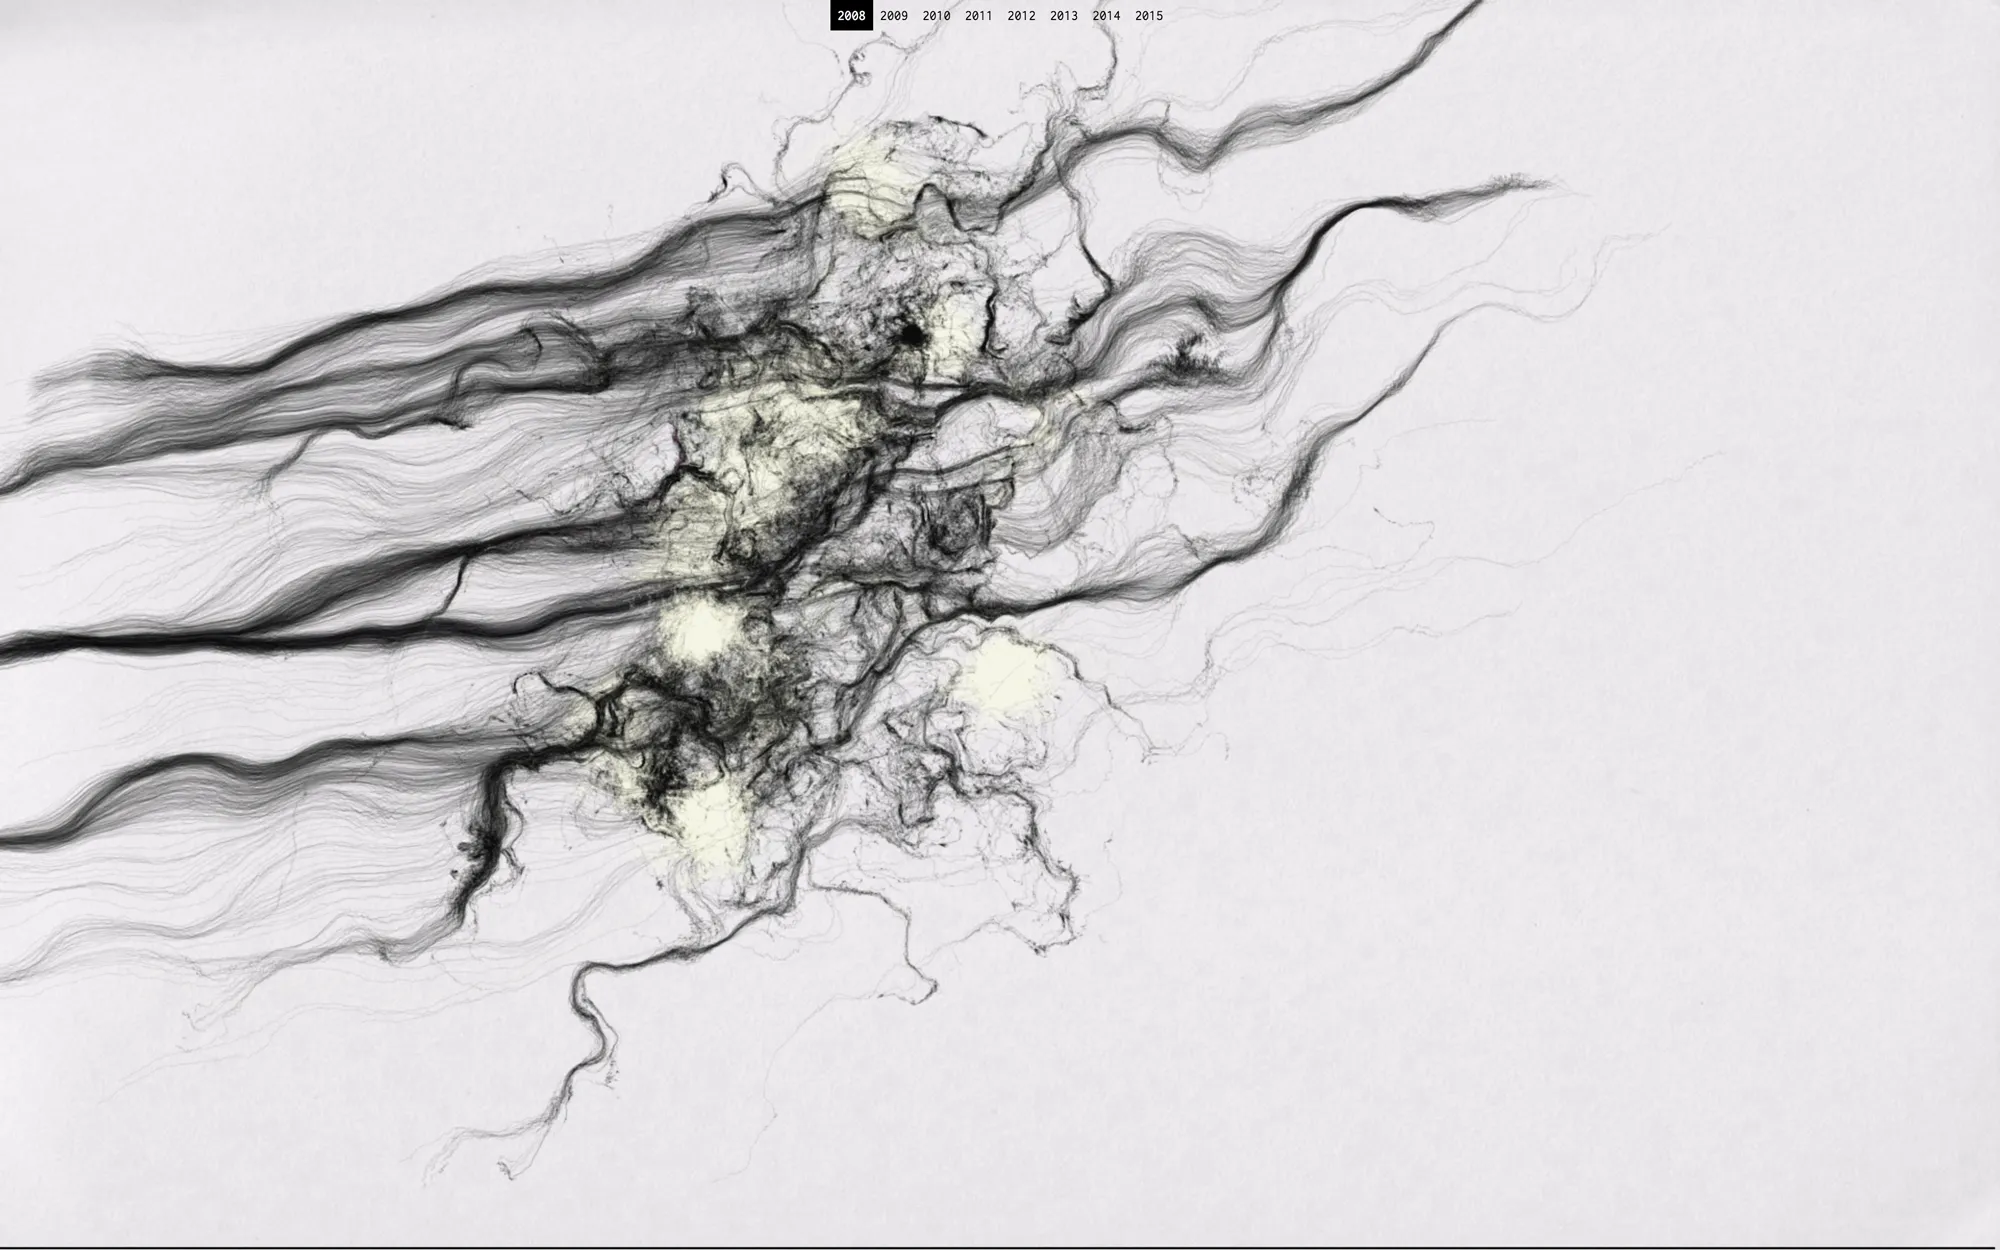
N.N.

Saturday, November 11, 2017

Substrate Watercolor (Jared Tarbell)

Saturday, April 30, 2016

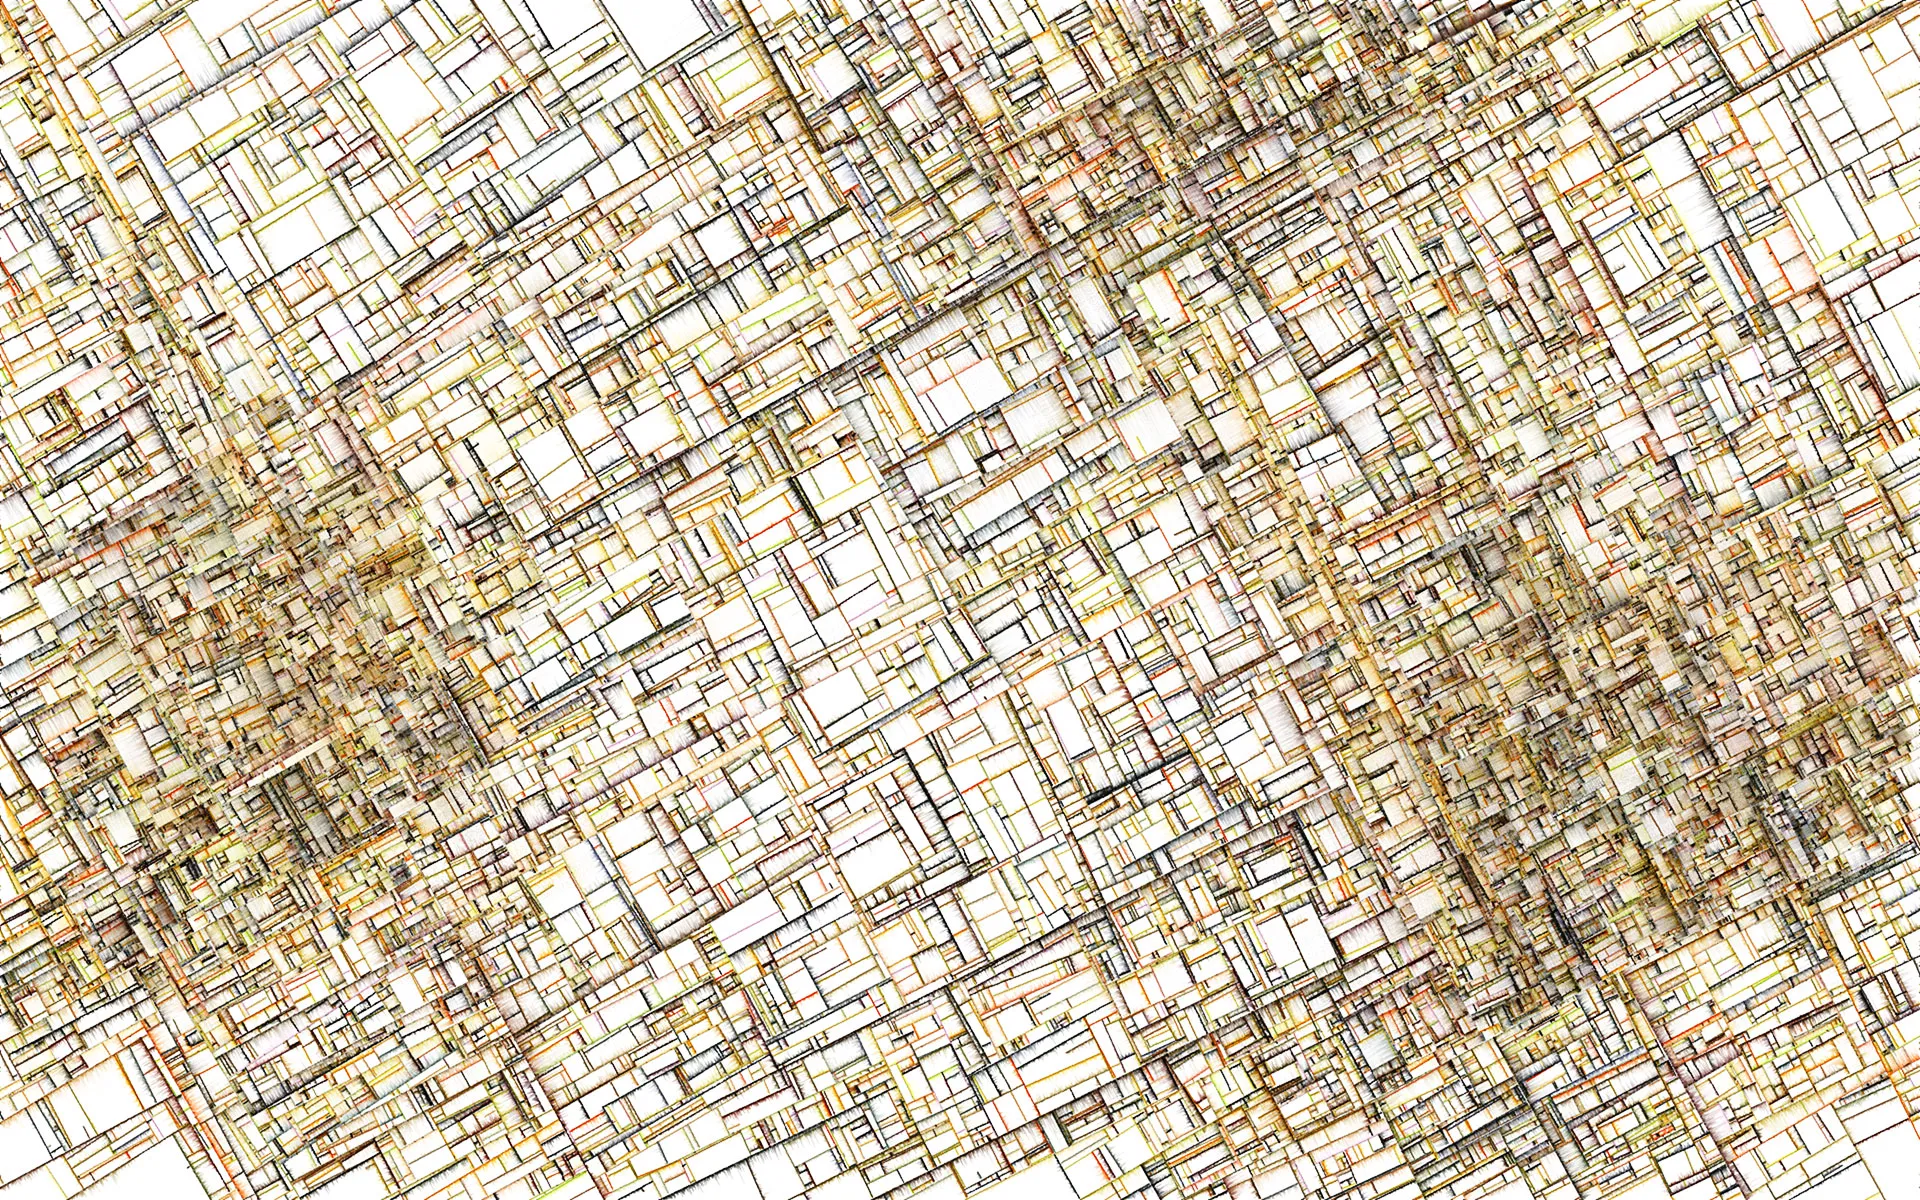
Another port of Processing code to JavaScript from the work by Jared Tarbell. This one is a good example of visualizing a system with emerging properties. The rules it follows can be summarized to: paint "cracks" that grow in straight lines, when the crack reaches a border, stop and start new cracks somehwere else. The results are rich in complexity. See Tarbell`s original code.

Empathy (Kyle McDonald)

Thursday, April 21, 2016

I found McDonald's work to be unique in the way that a simple interaction seem to create a tactile experience. At the same time, the abstract render suggests to me a responsive simulation of a living system with "emotions". As the title suggests, he was aiming for "empathy". To learn how he did this, I translated the code he originally created on Processing into JavScript. All credits go to Kyle McDonald. See the original source code and more of his work at kylemcdonald.net

Flock B

Wednesday, March 16, 2016

Flock with rotating figure, testing drawings with depth and WebGL renderer.

Monitor Info

Sunday, January 3, 2016

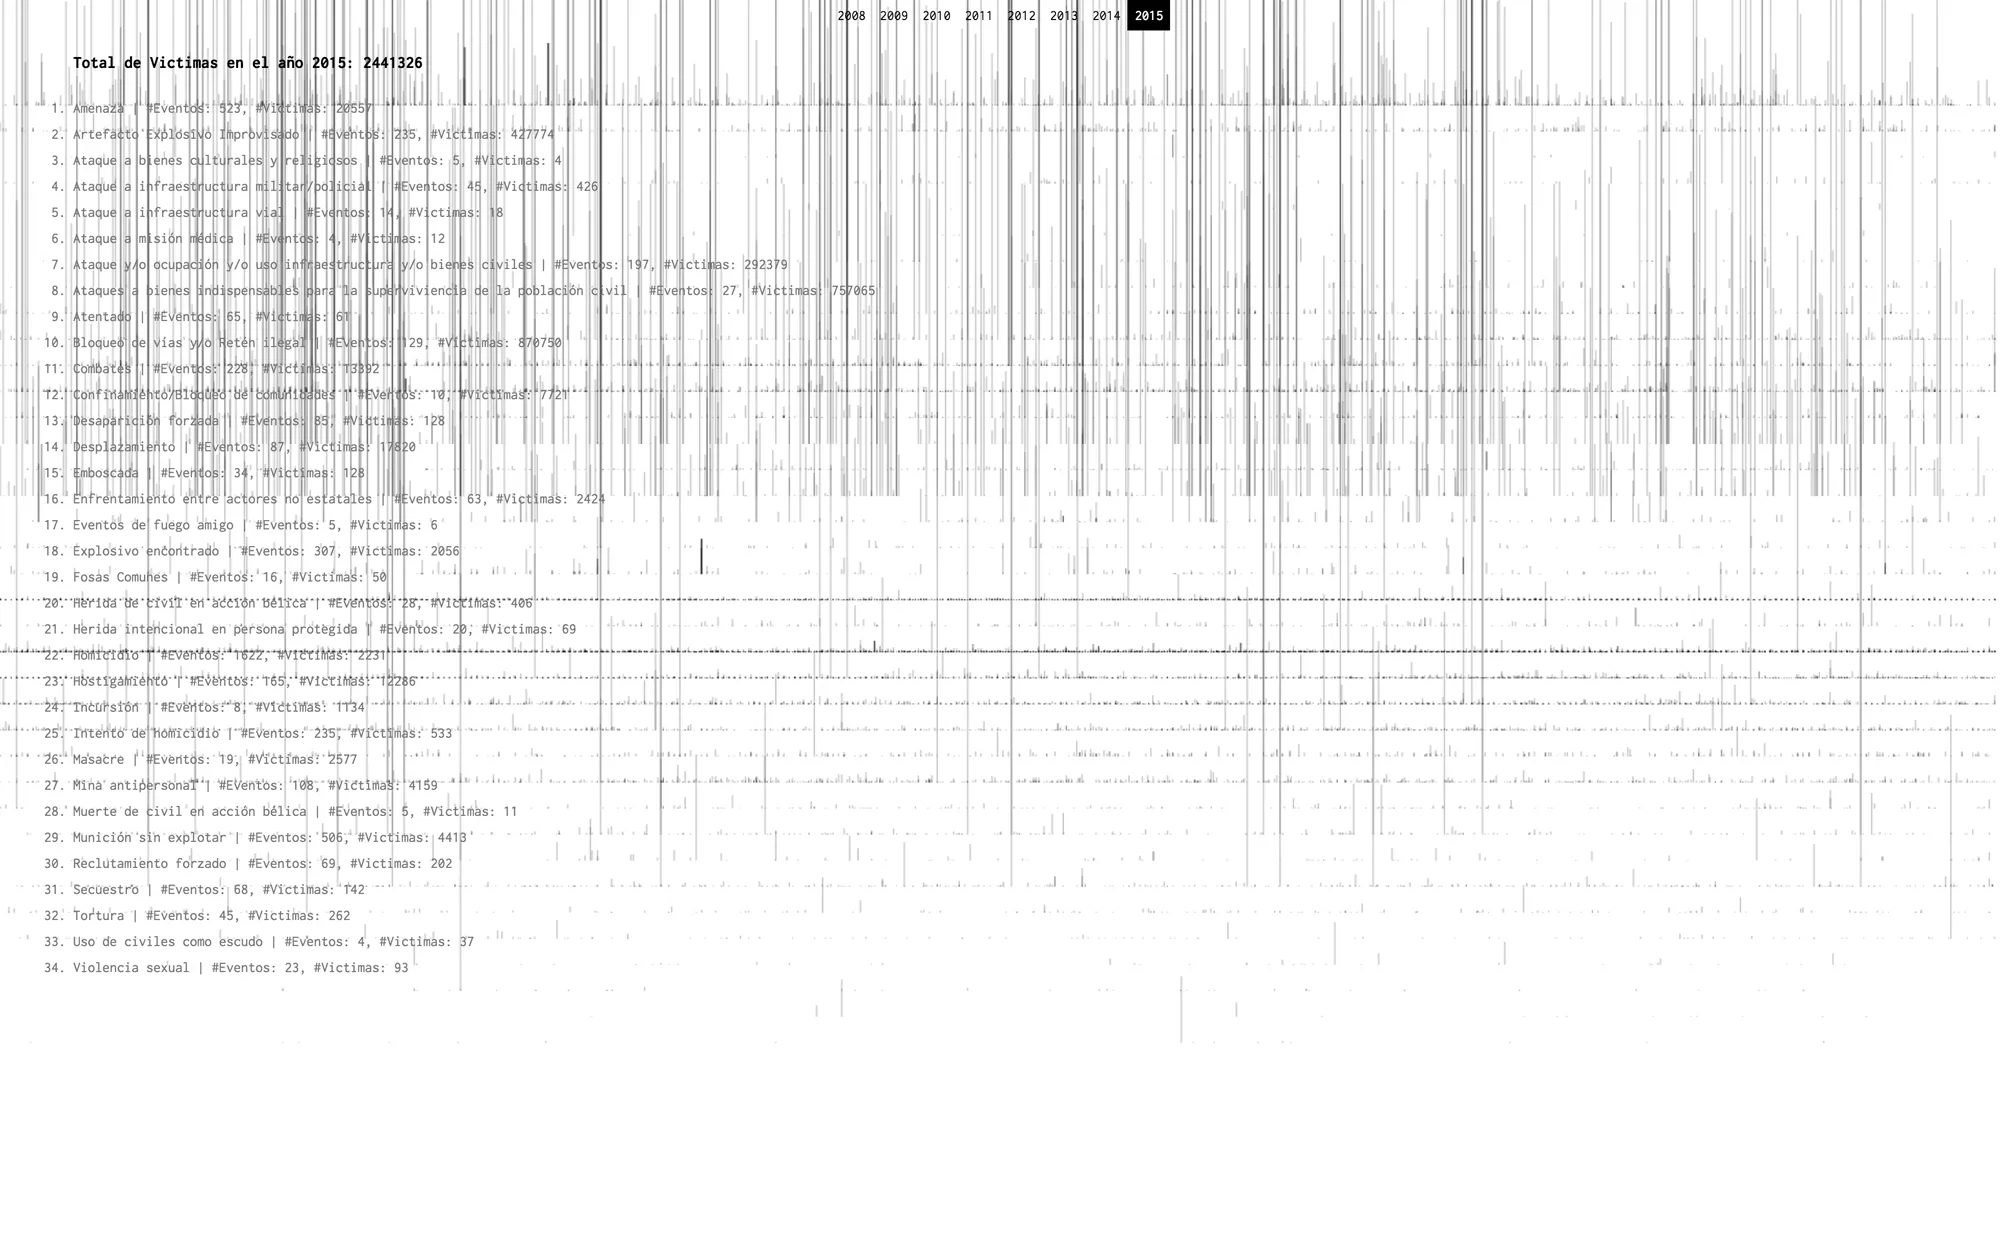
Application to quickly visualize the frequency and total victims in the data-sets from Monitor.

Defunciones

Tuesday, October 27, 2015

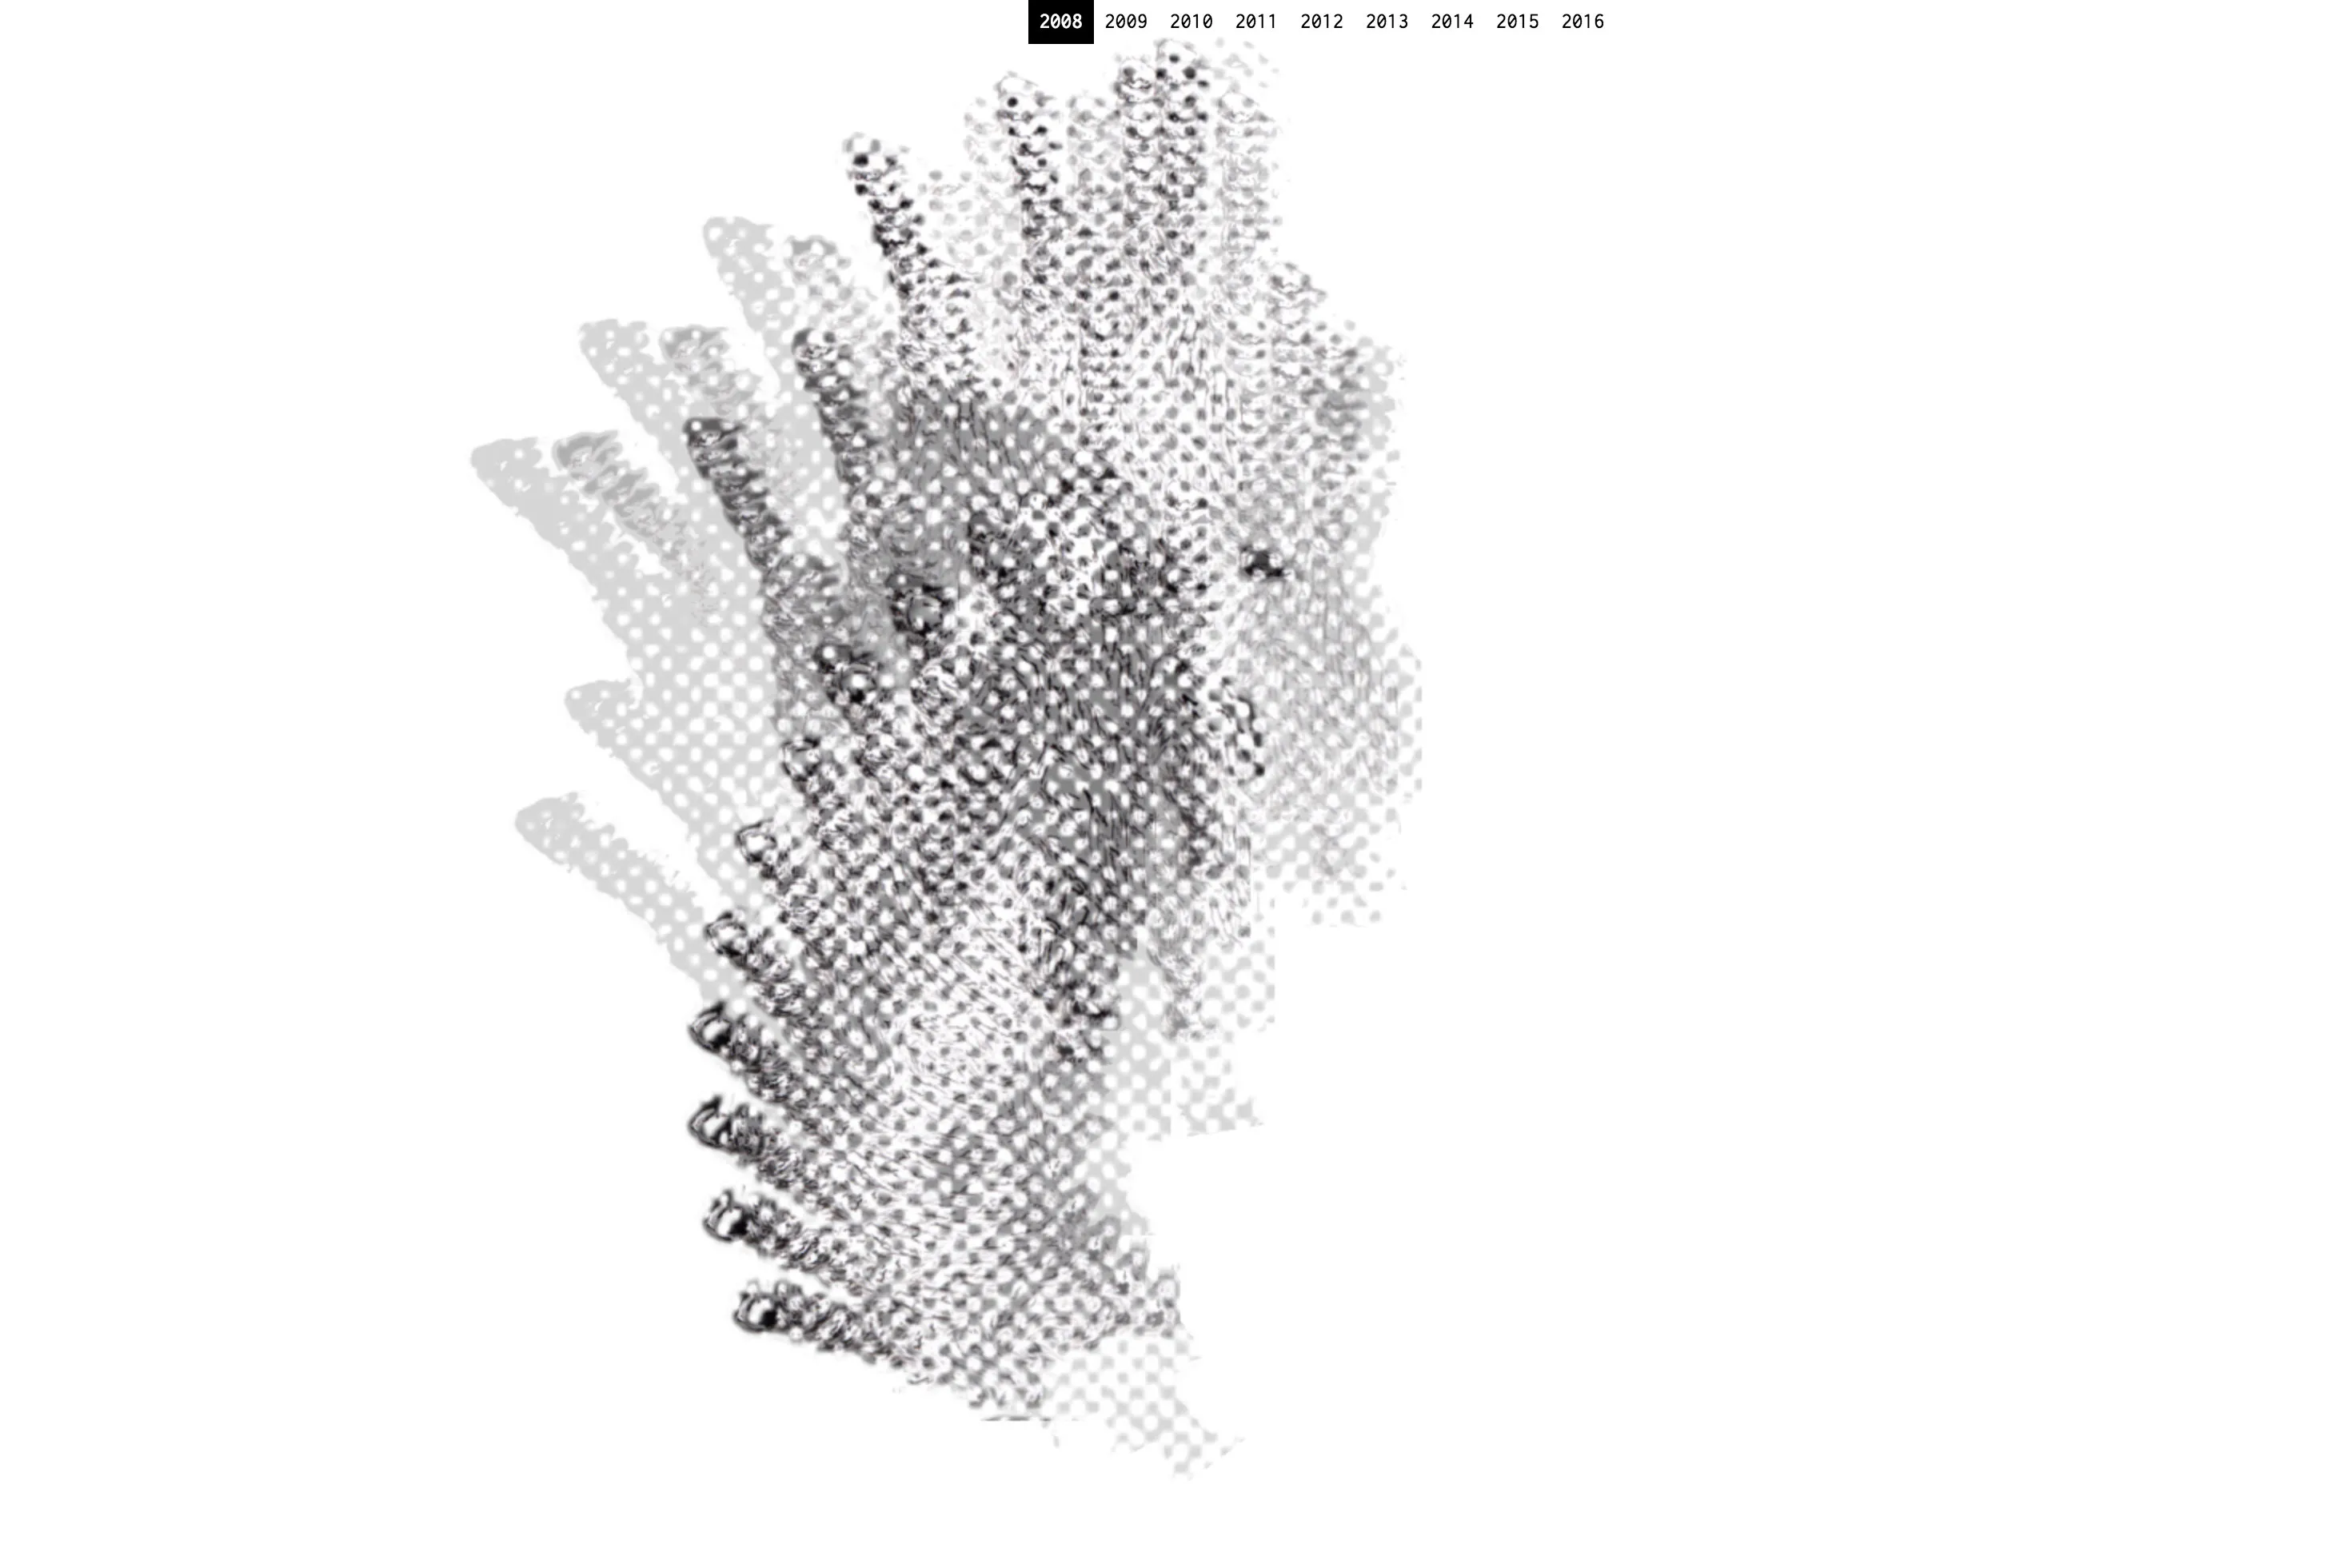
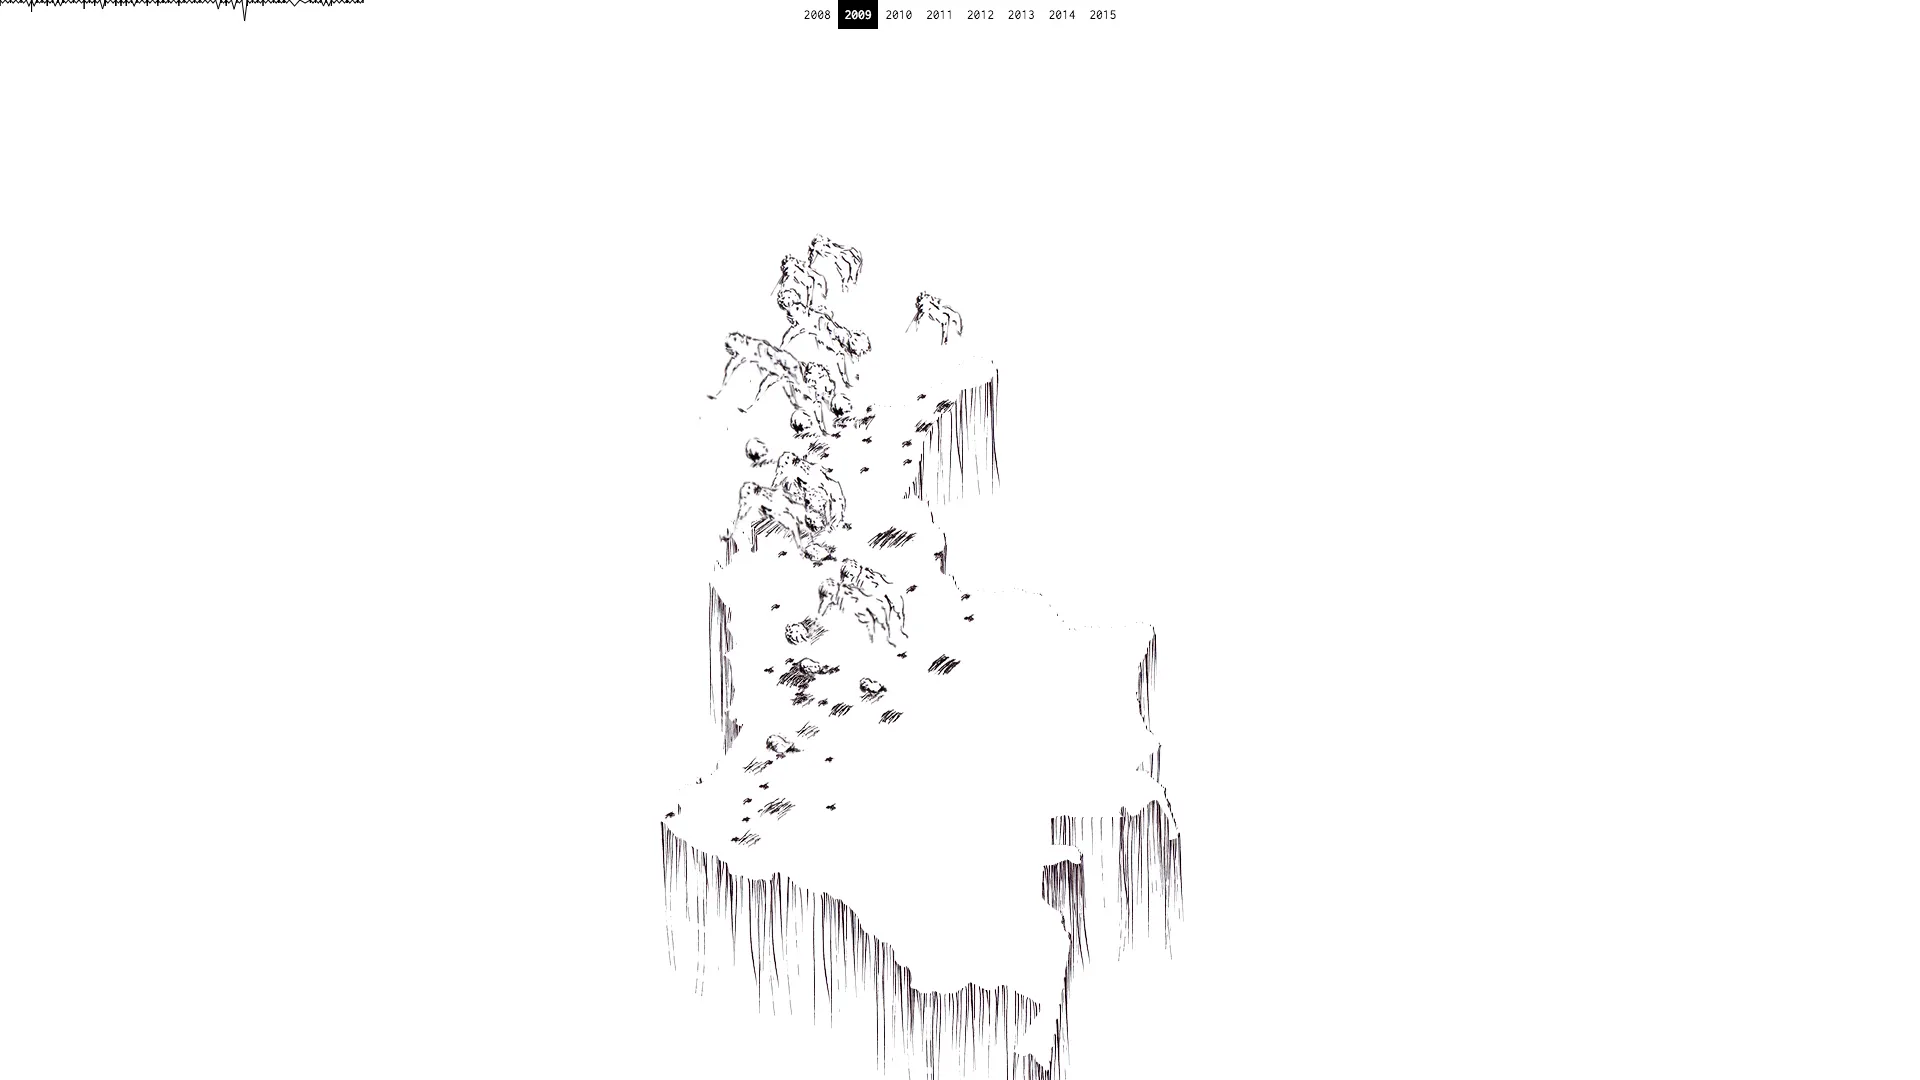
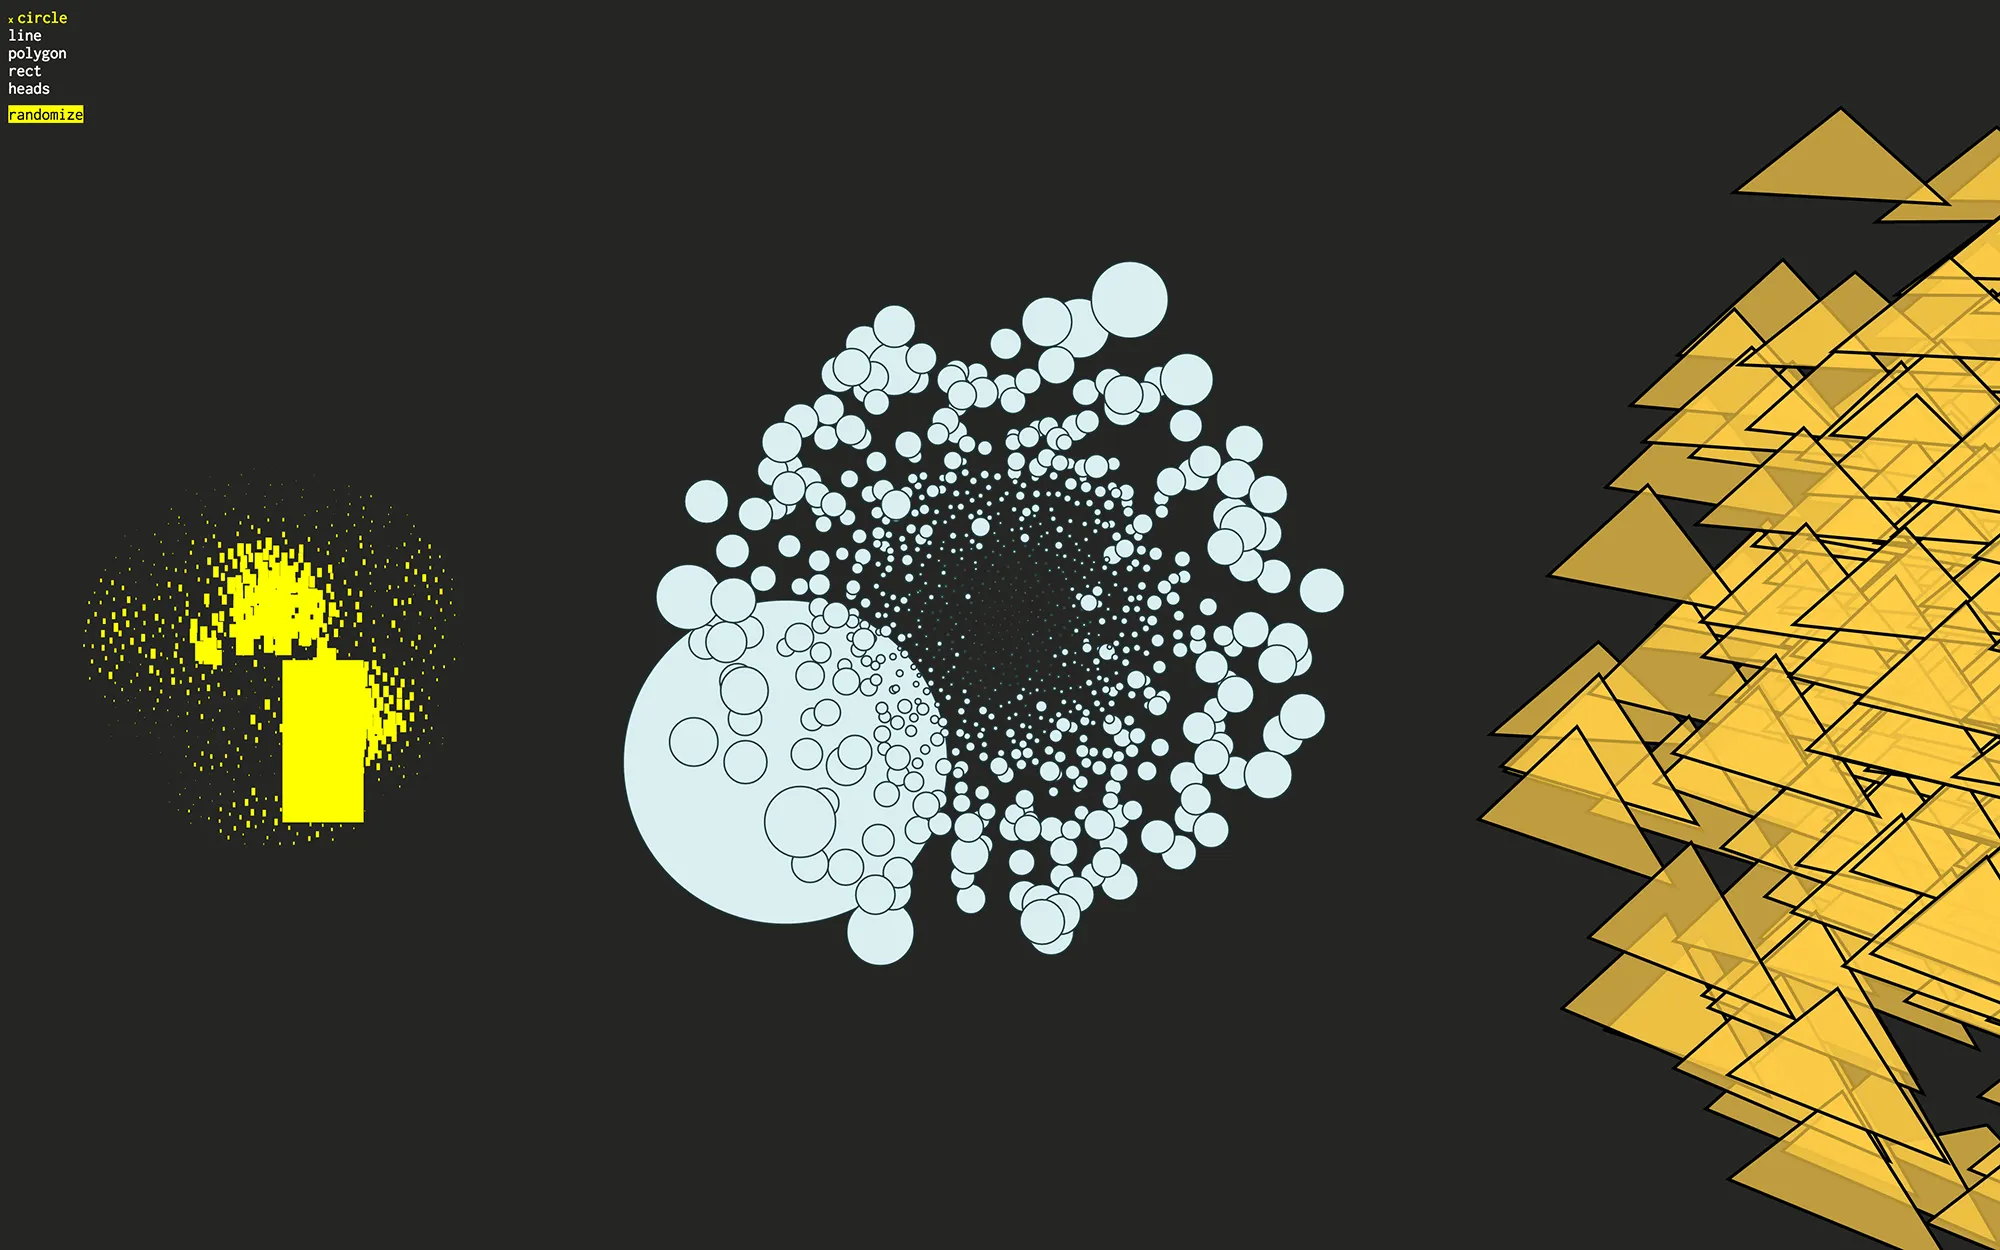
Quick sketch mapping violence (yearly homicides in Colombia) data with animation sprites.

Pulse Analysis C

Tuesday, October 27, 2015

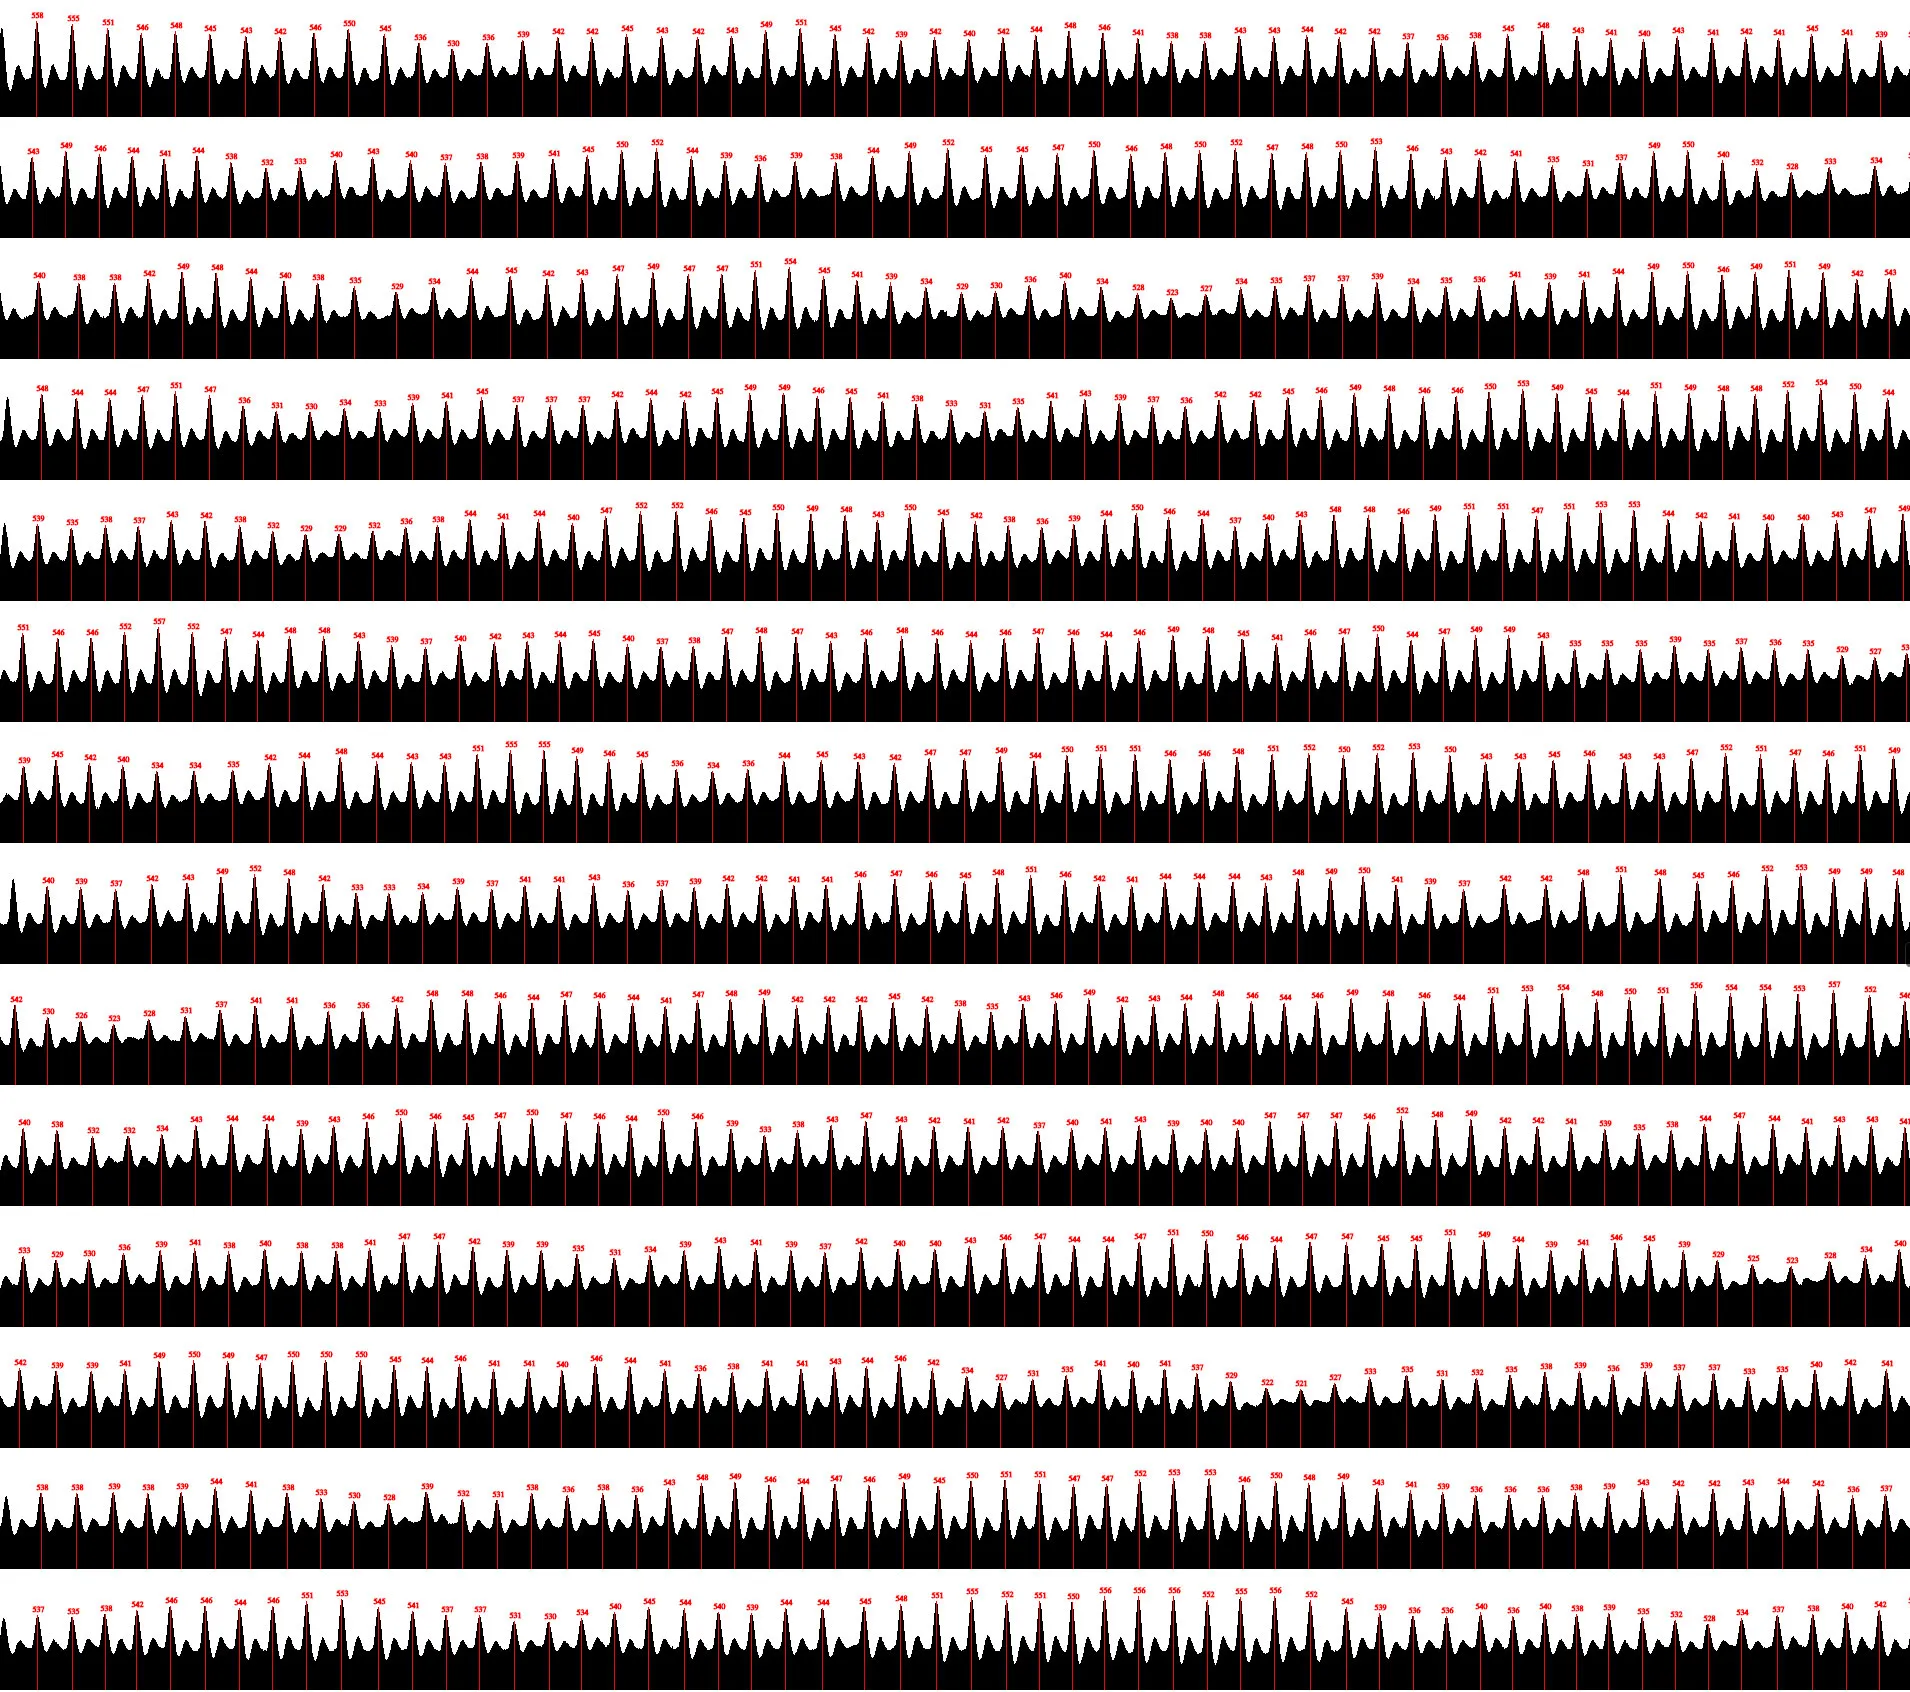
Visualization to aid the parsing, cleaning and analysis of pulse data. Variation C.

Pulse Analysis B

Tuesday, October 27, 2015

Visualization to aid the parsing, cleaning and analysis of pulse data. Variation B.

Guts (Jared Tarbell)

Friday, October 16, 2015

A translation of Jared Tarbell's "Guts" from Processing to JavaScript. See original source code, or more of Tarbell's work at complexification.net.

Flock A

Wednesday, September 16, 2015

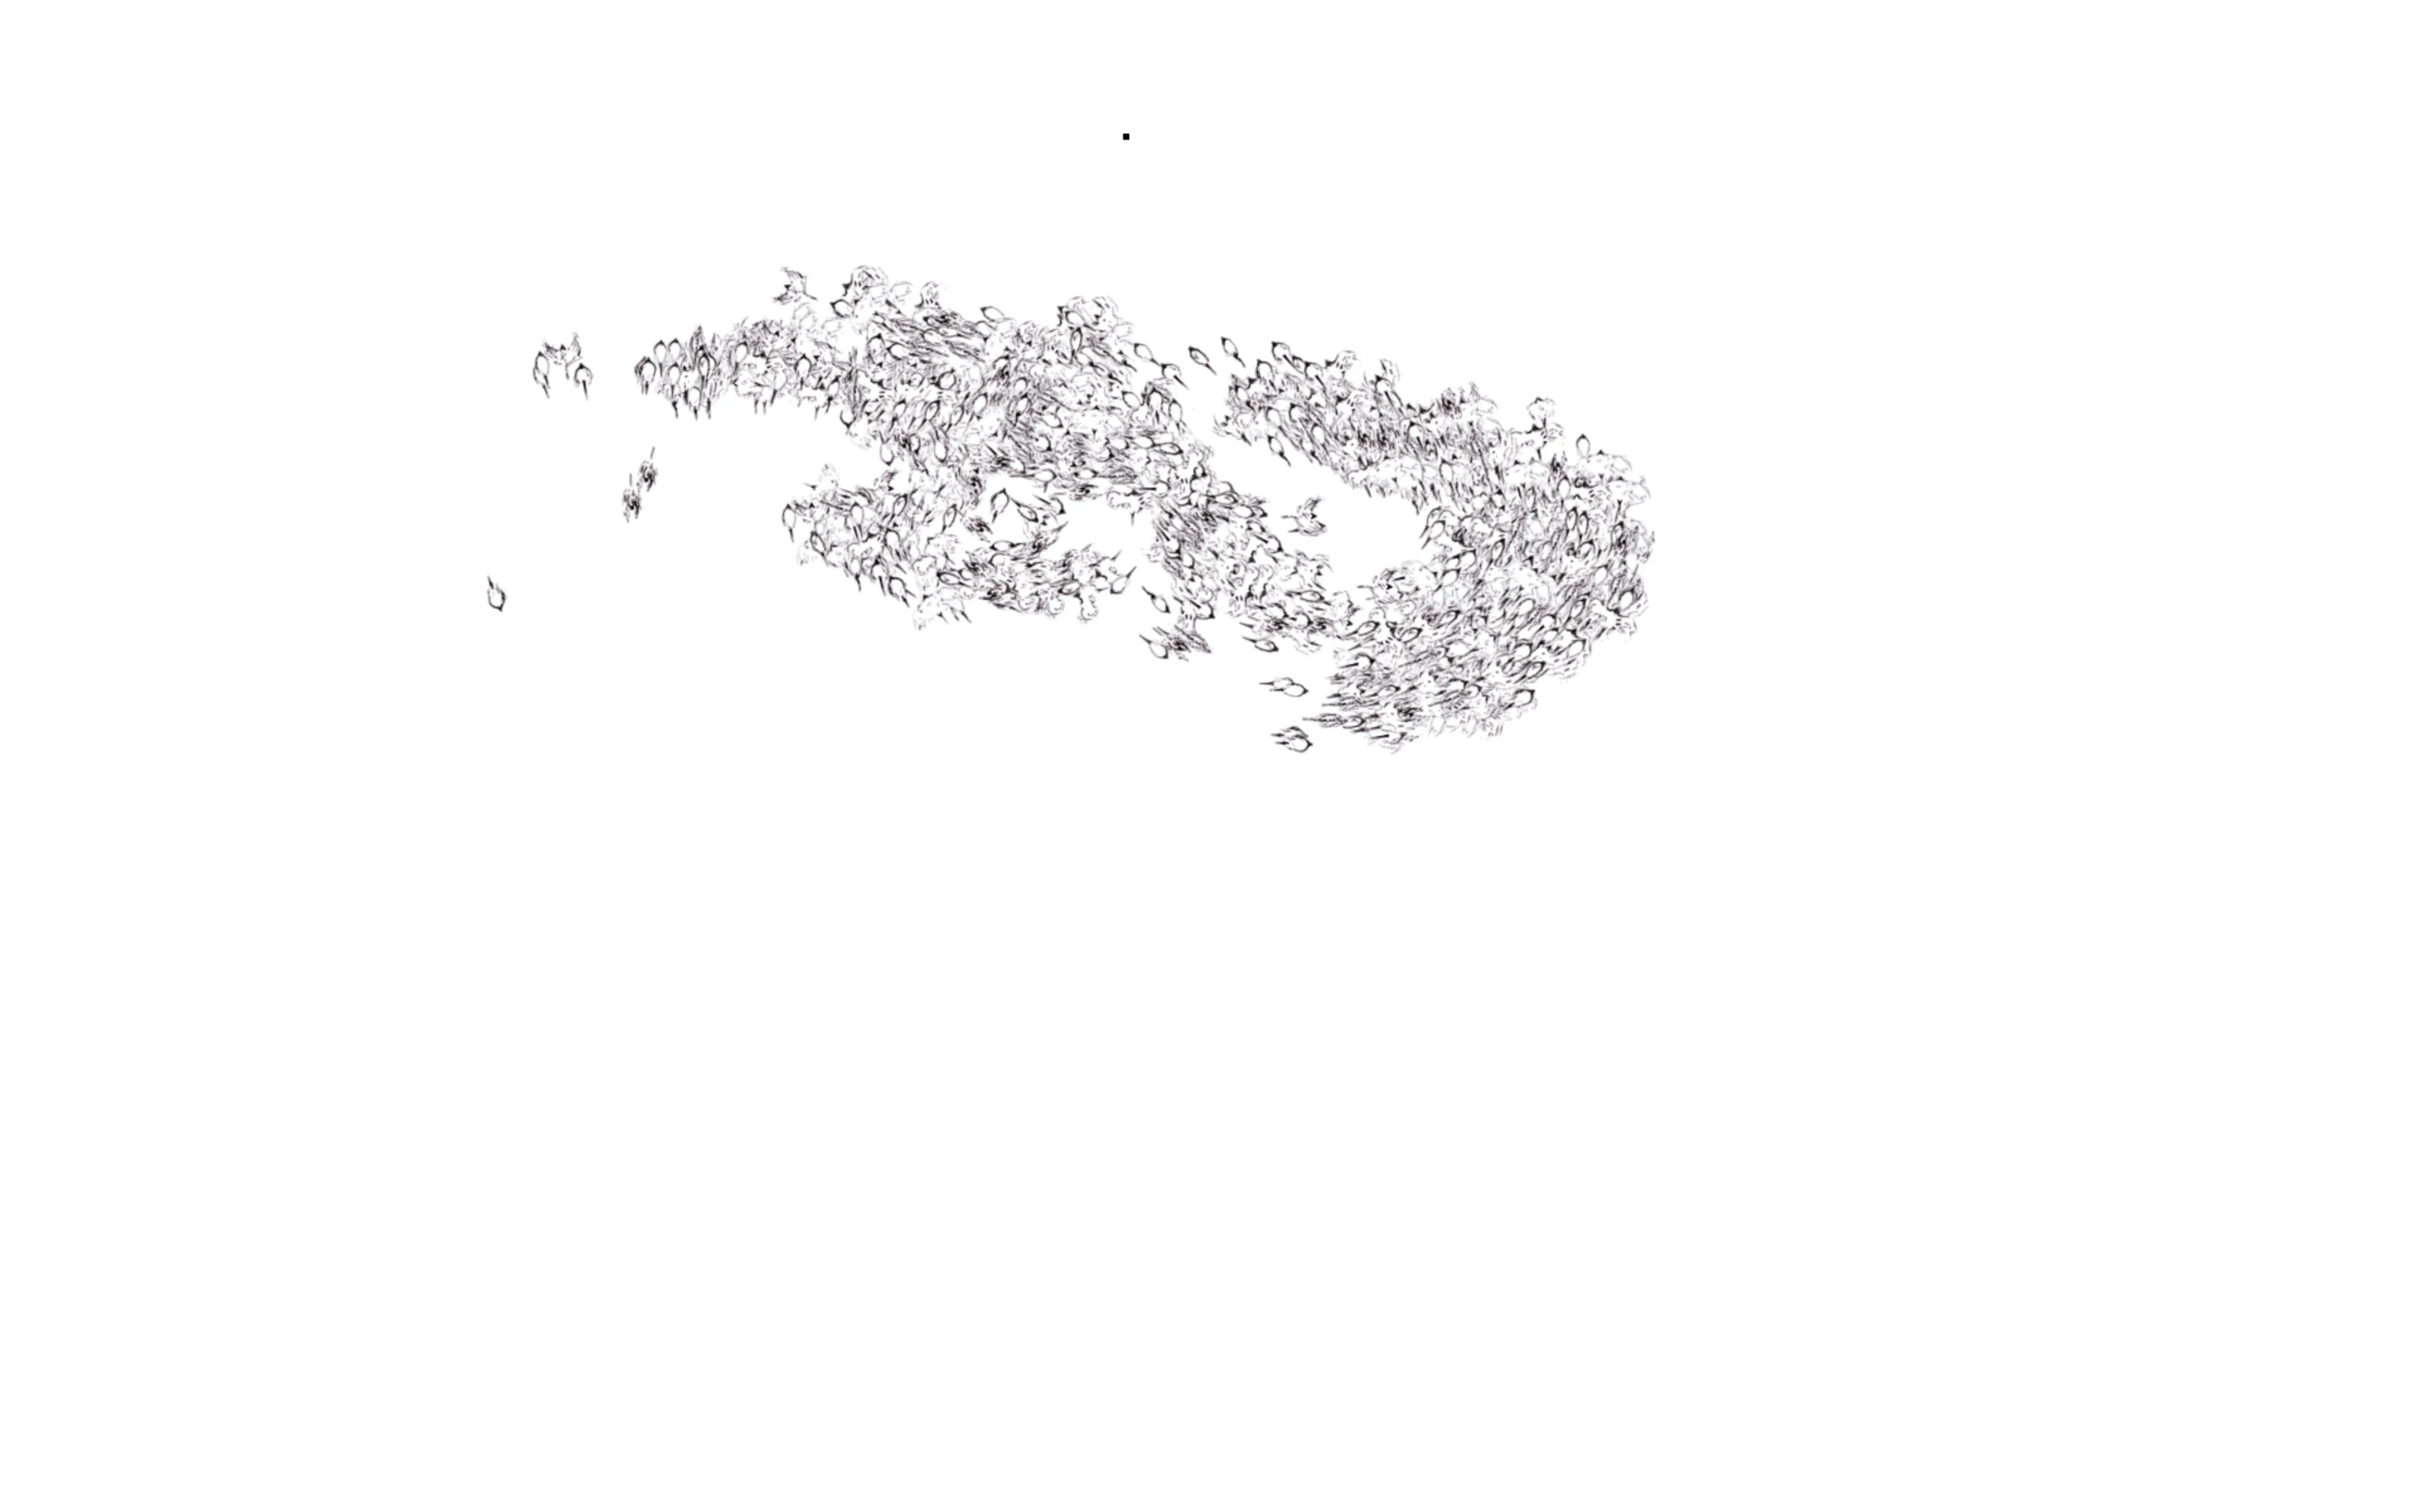
Flock of birds that fly towards geolocation of seismic data in Colombia. Experimenting with hand drawn sprites and particle system (1555, 1 per victim of terrorist attacks in Colombia from 1988-2012 based on CMH).

Bubble Chamber (Jared Tarbell)

Tuesday, September 15, 2015

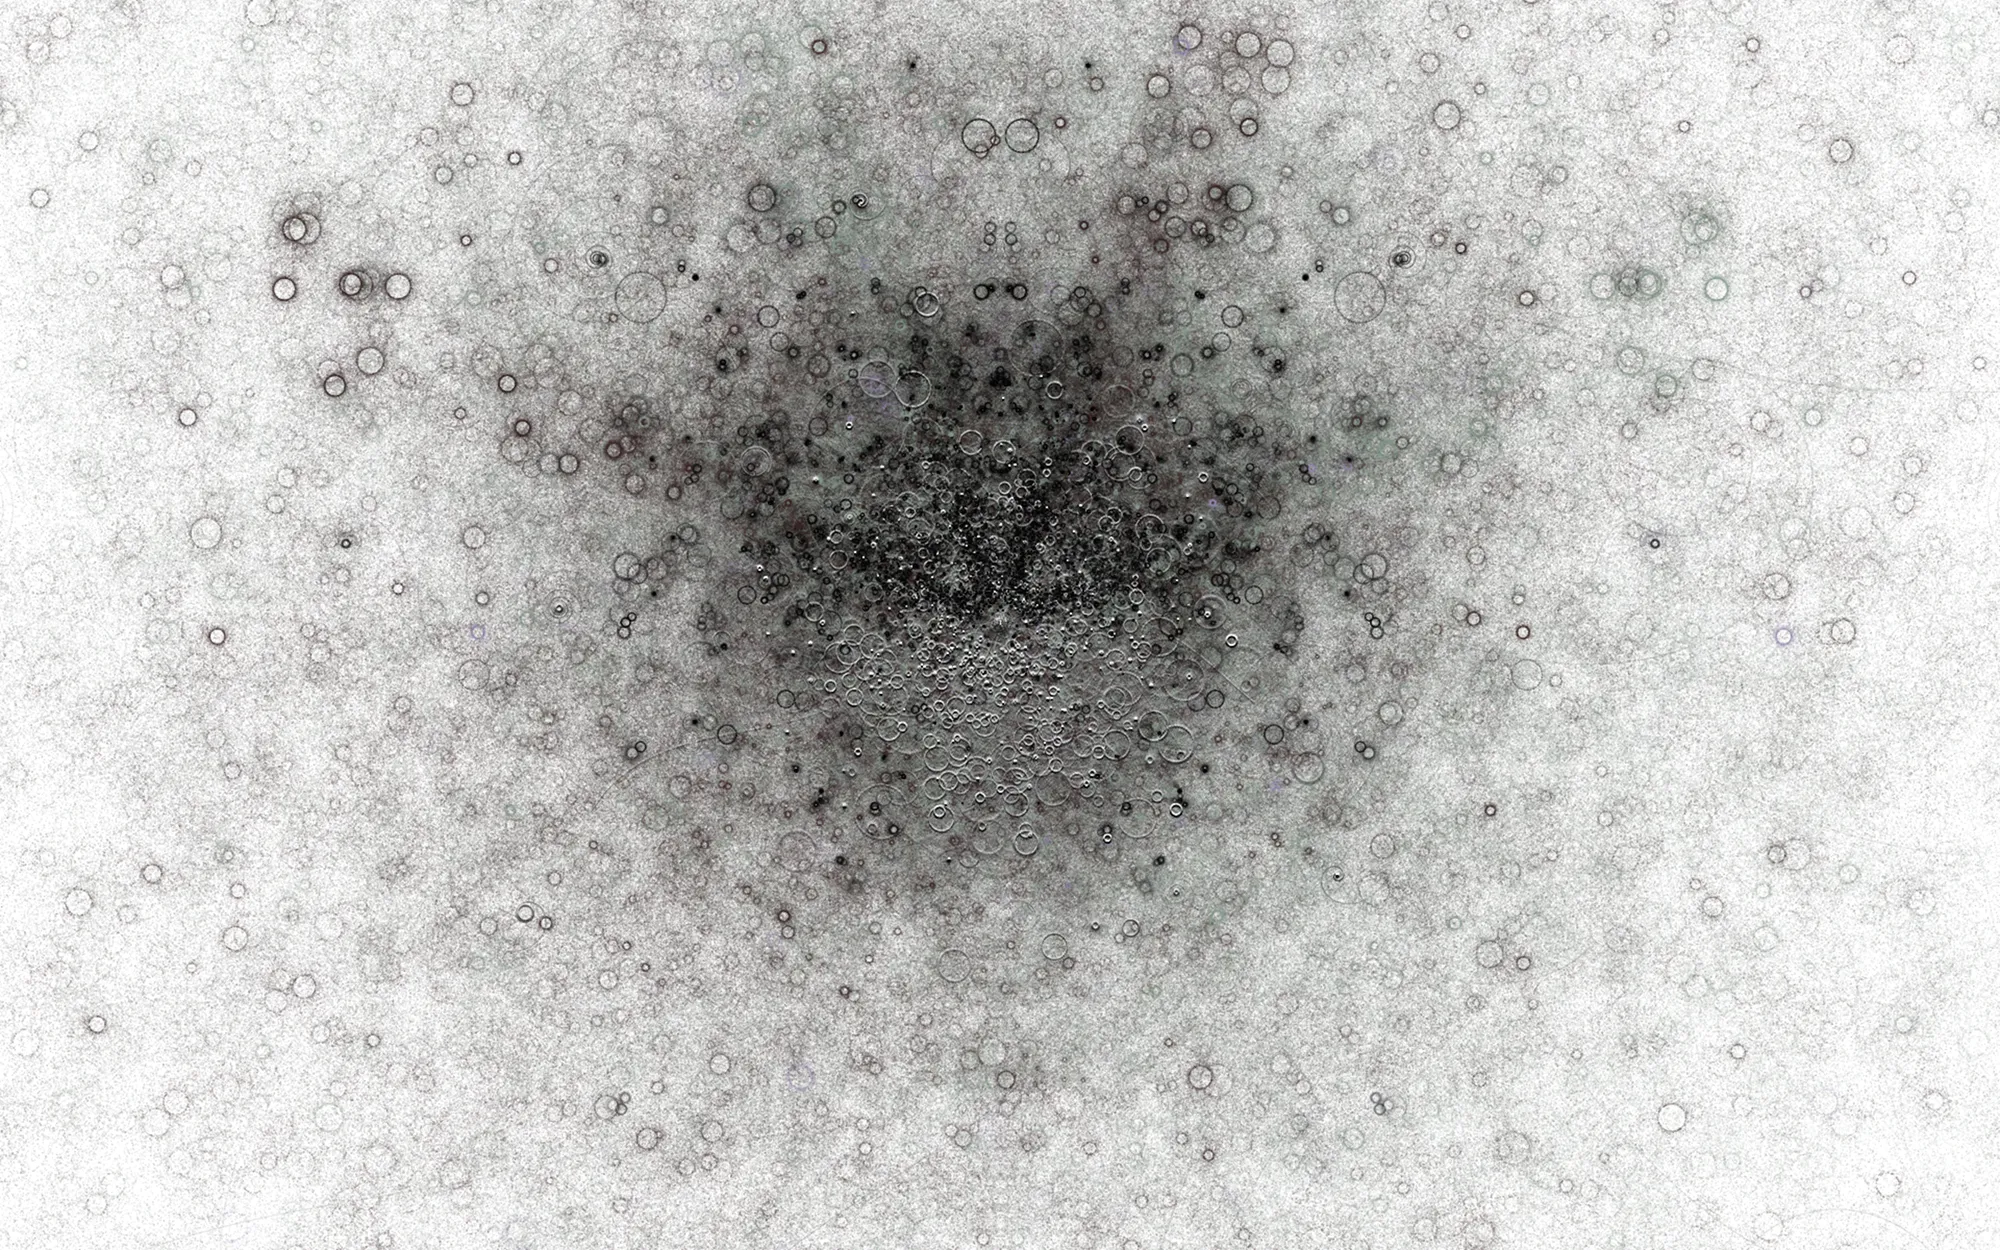
A translation of Jared Tarbell's "Bubble Chamber" from Processing to JavaScript. See his source code here.

Earthquakes Path

Saturday, September 12, 2015

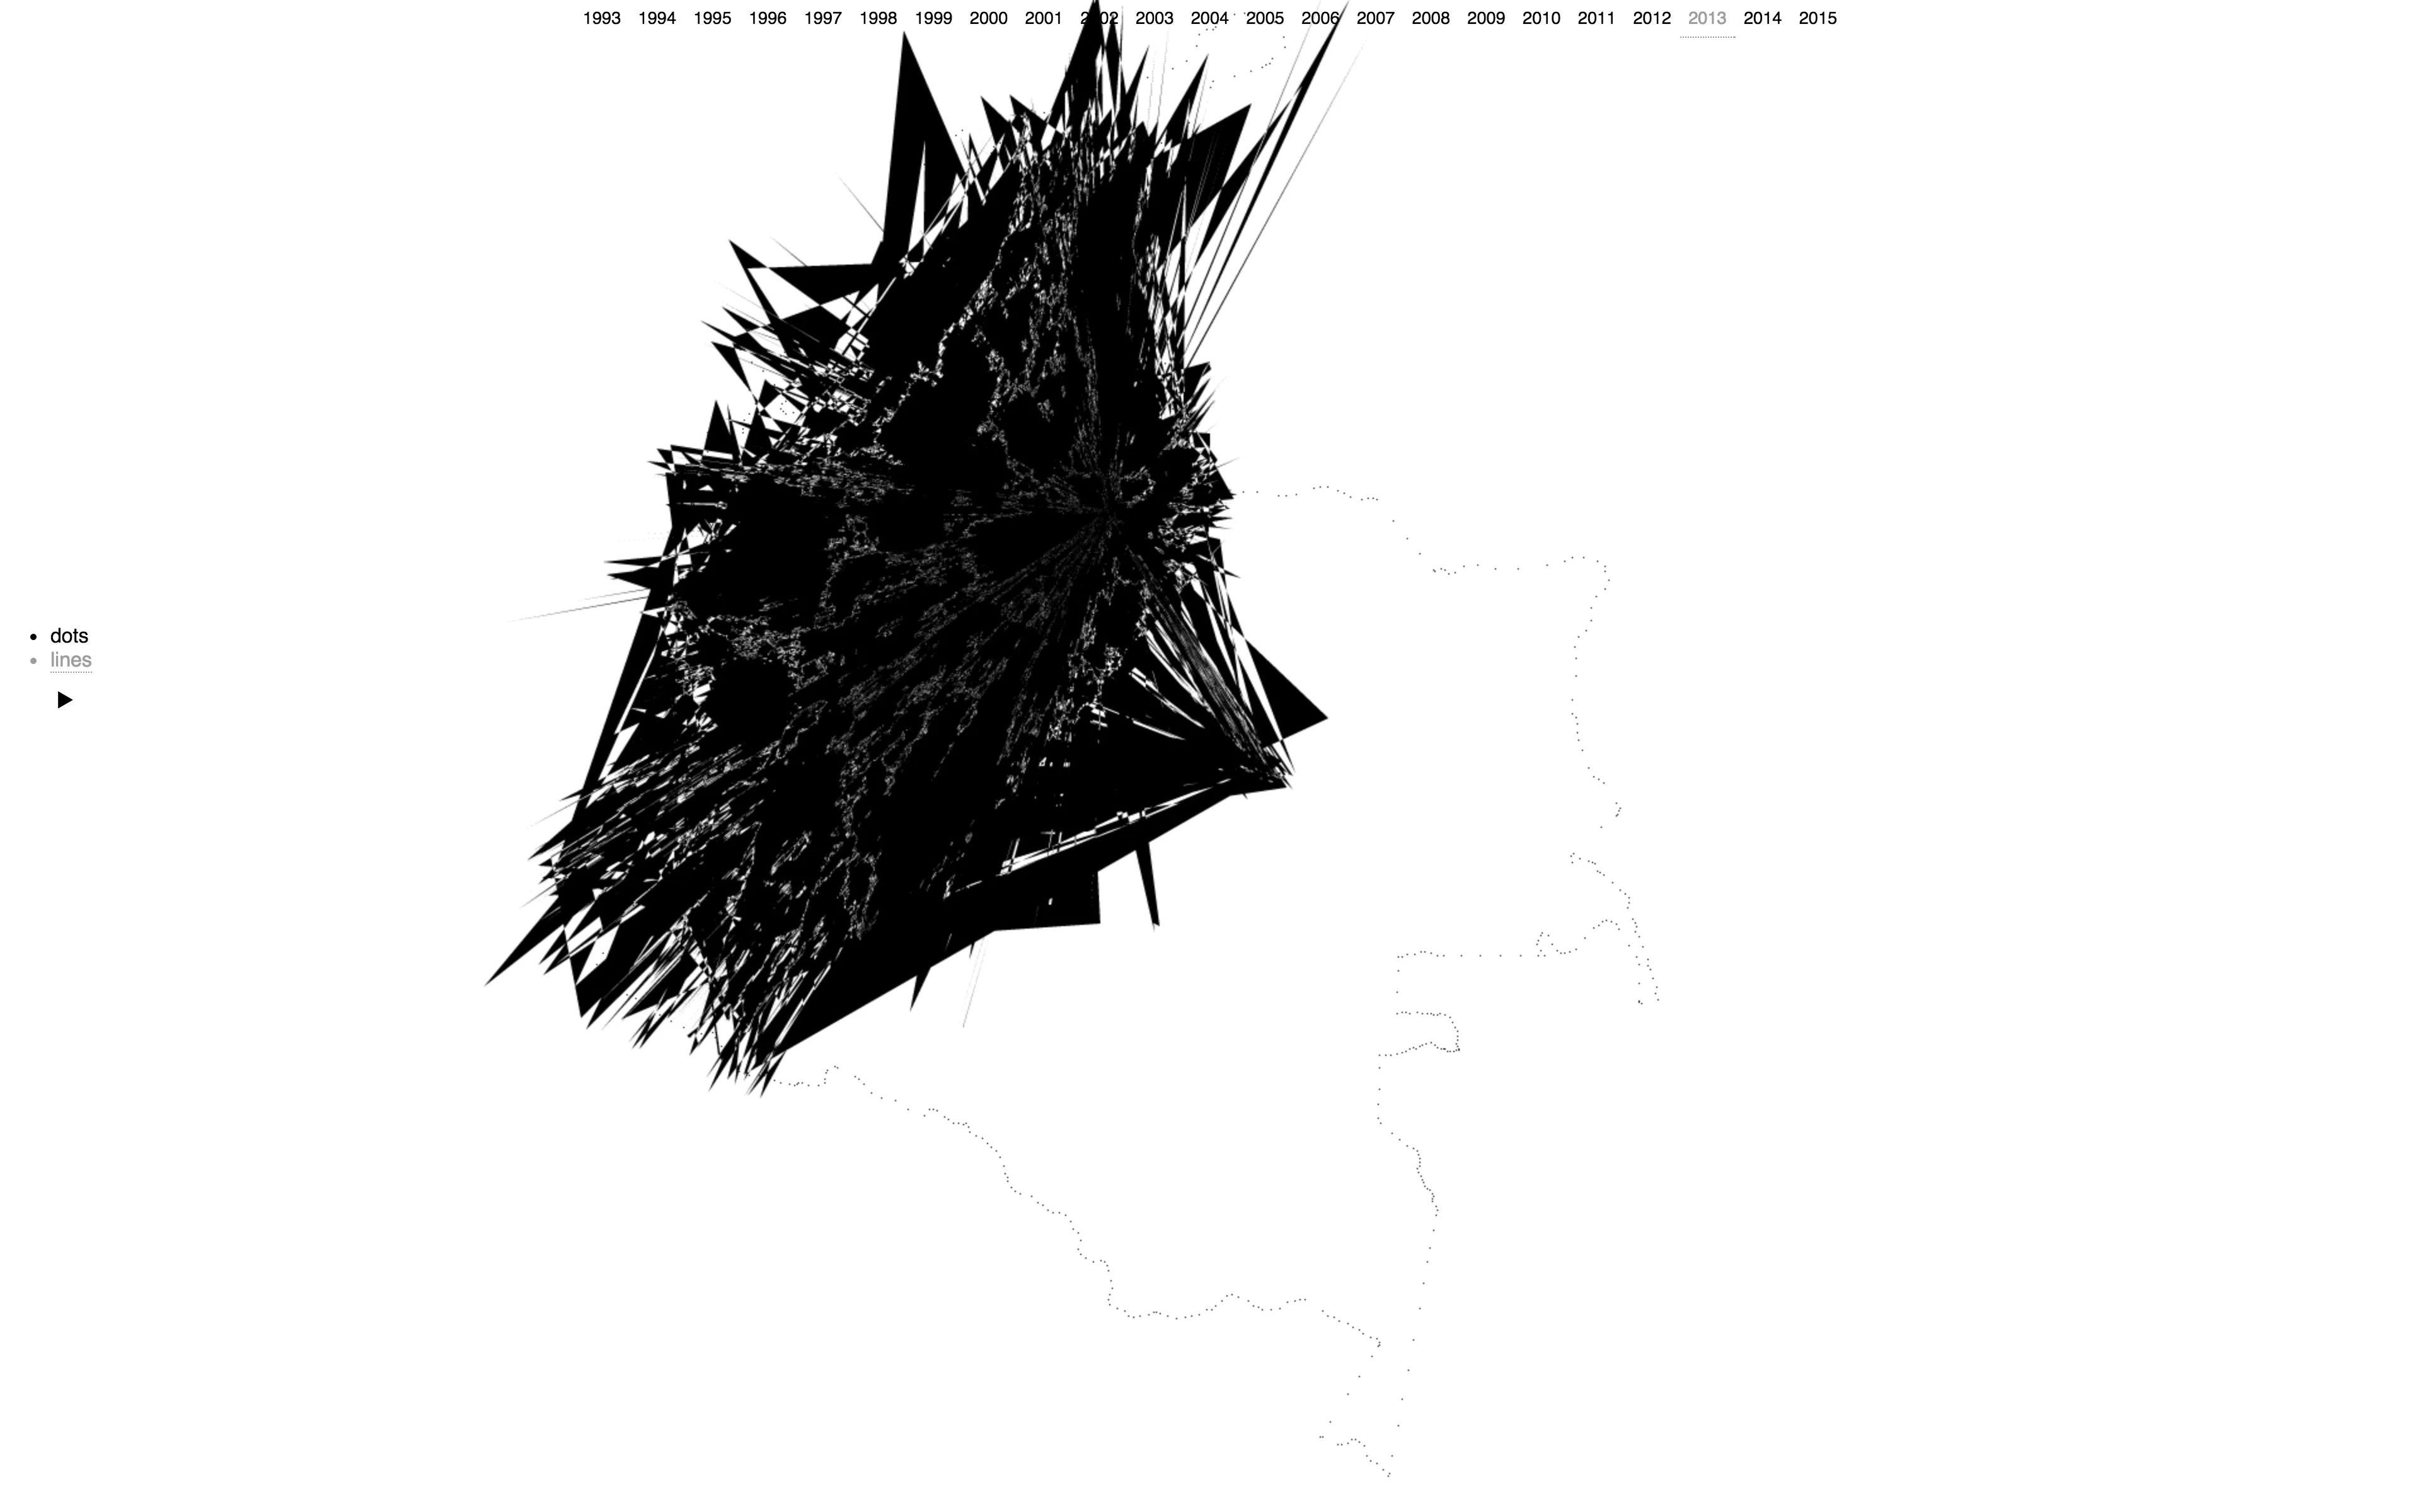
Dynamic rendering of seismic data over a Colombian map. The drawing decisions are made depending on the locations and dates of the seismic events.

Pulsescape Waves

Wednesday, September 9, 2015

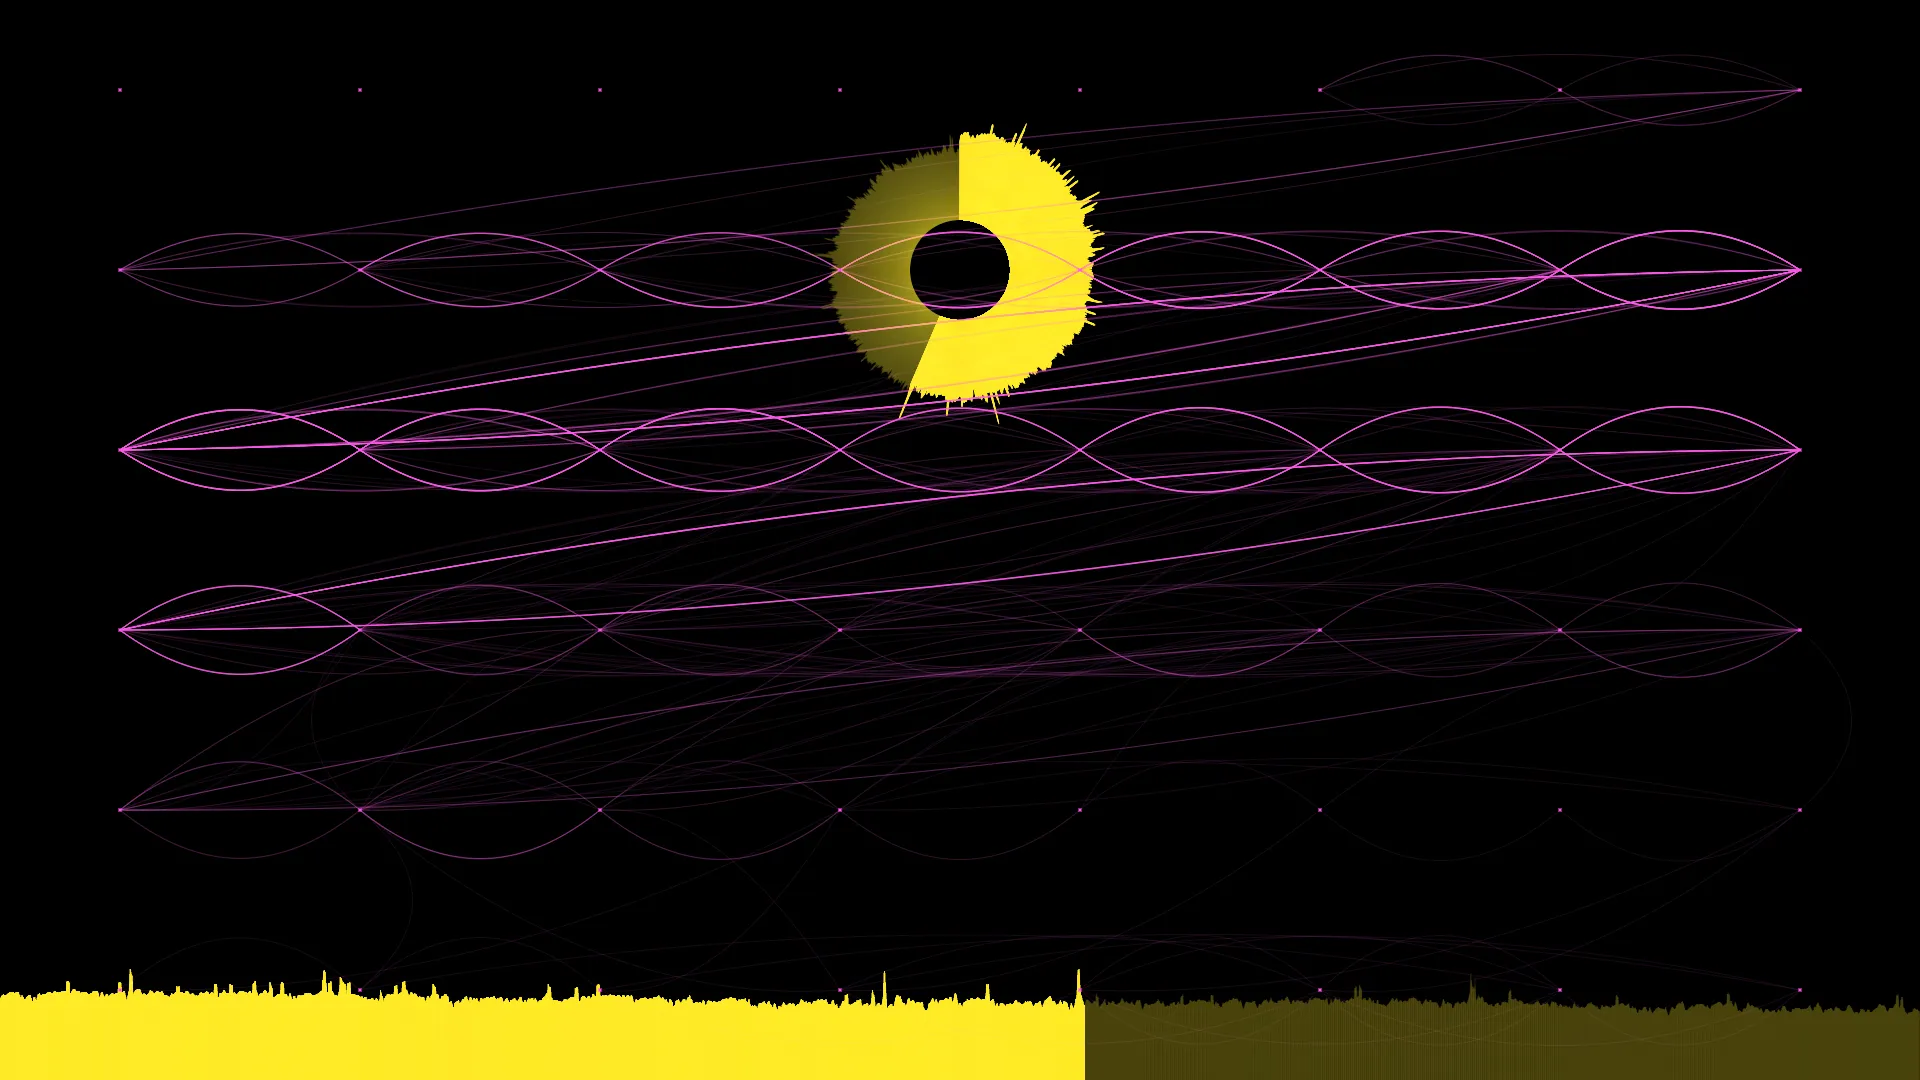
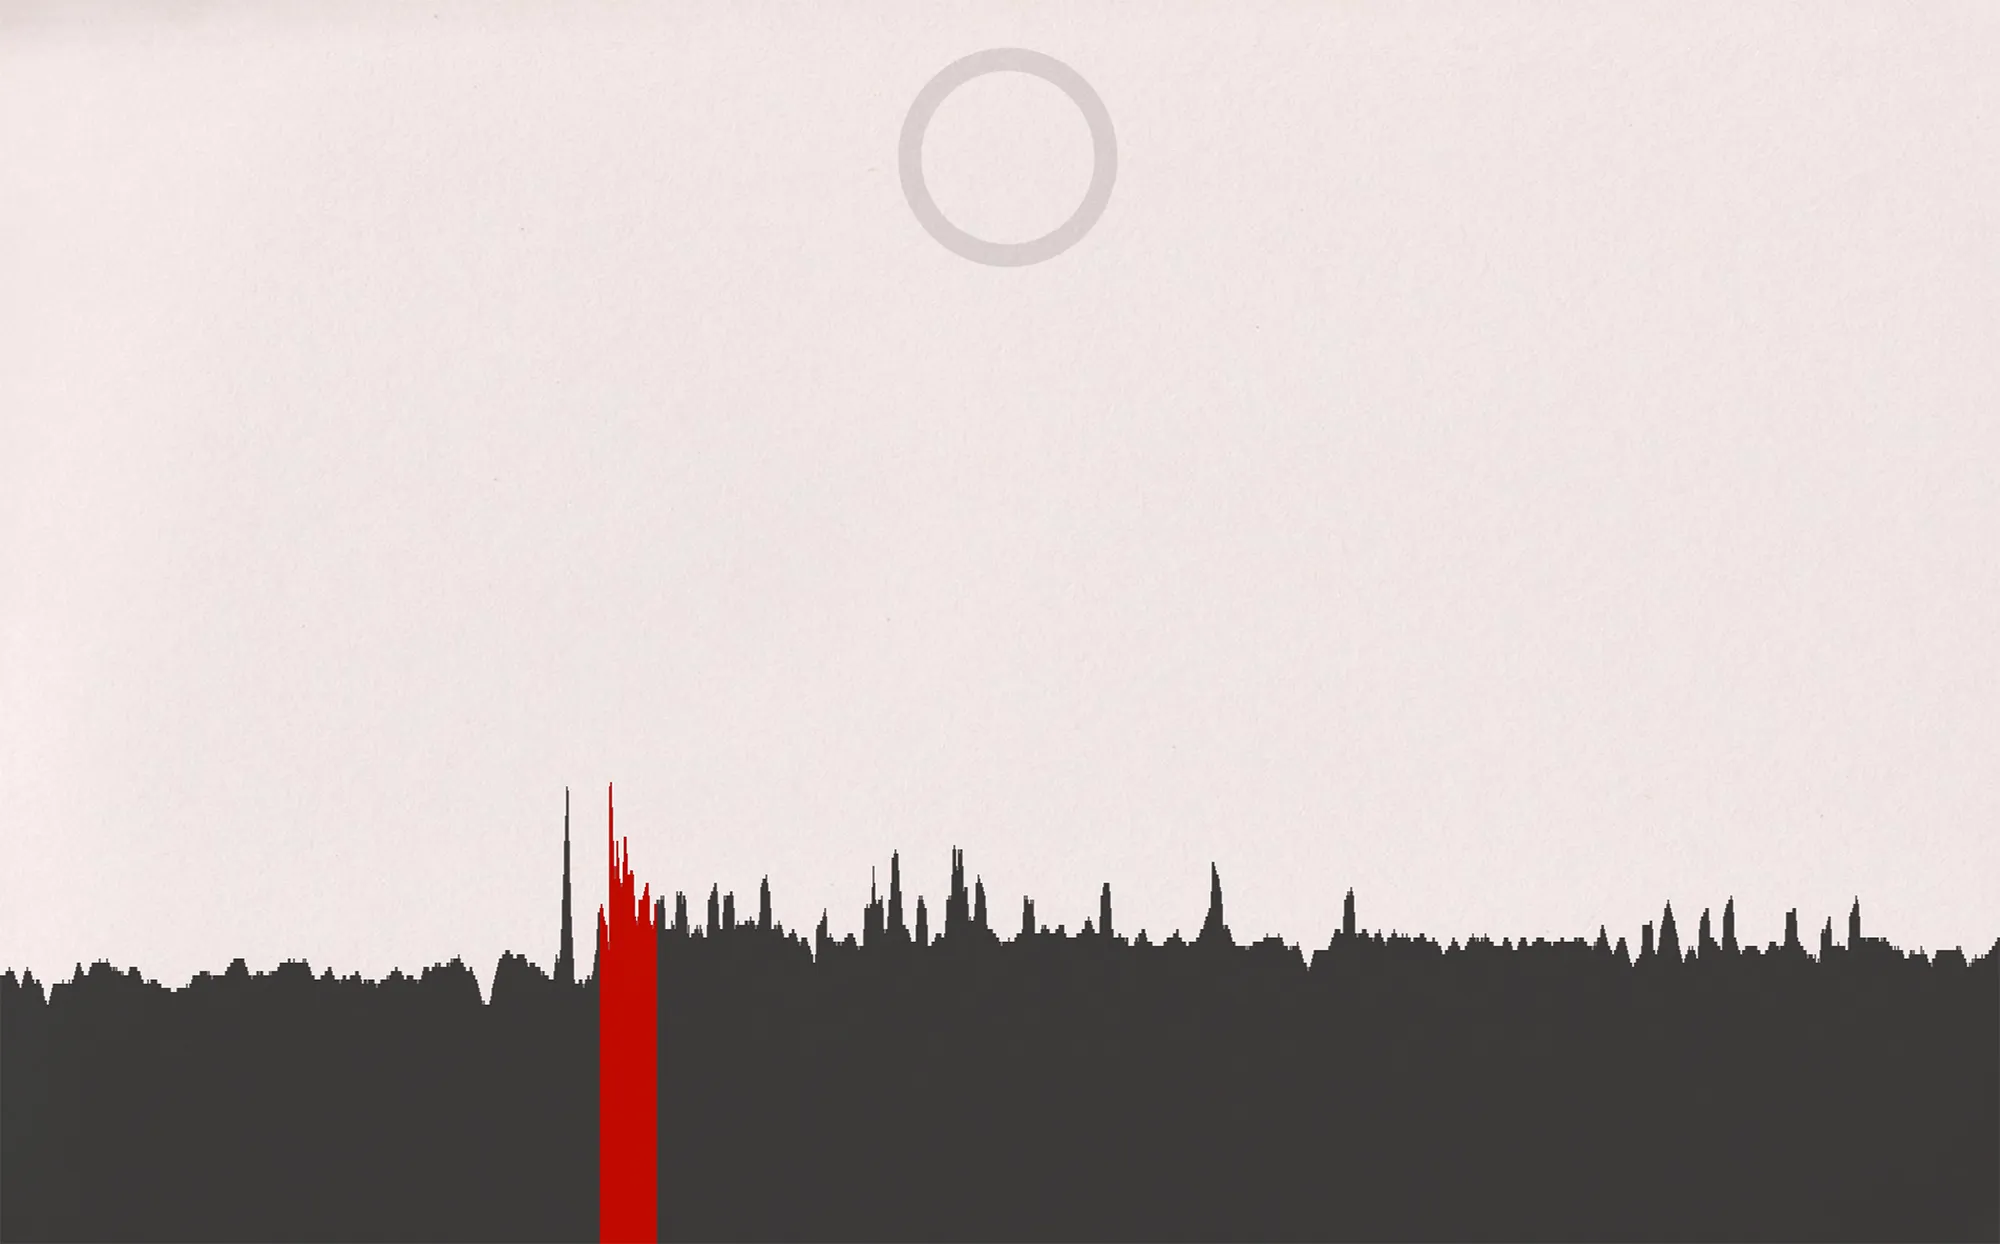
Pulse as waves

Binary Ring (Jared Tarbell)

Thursday, September 3, 2015

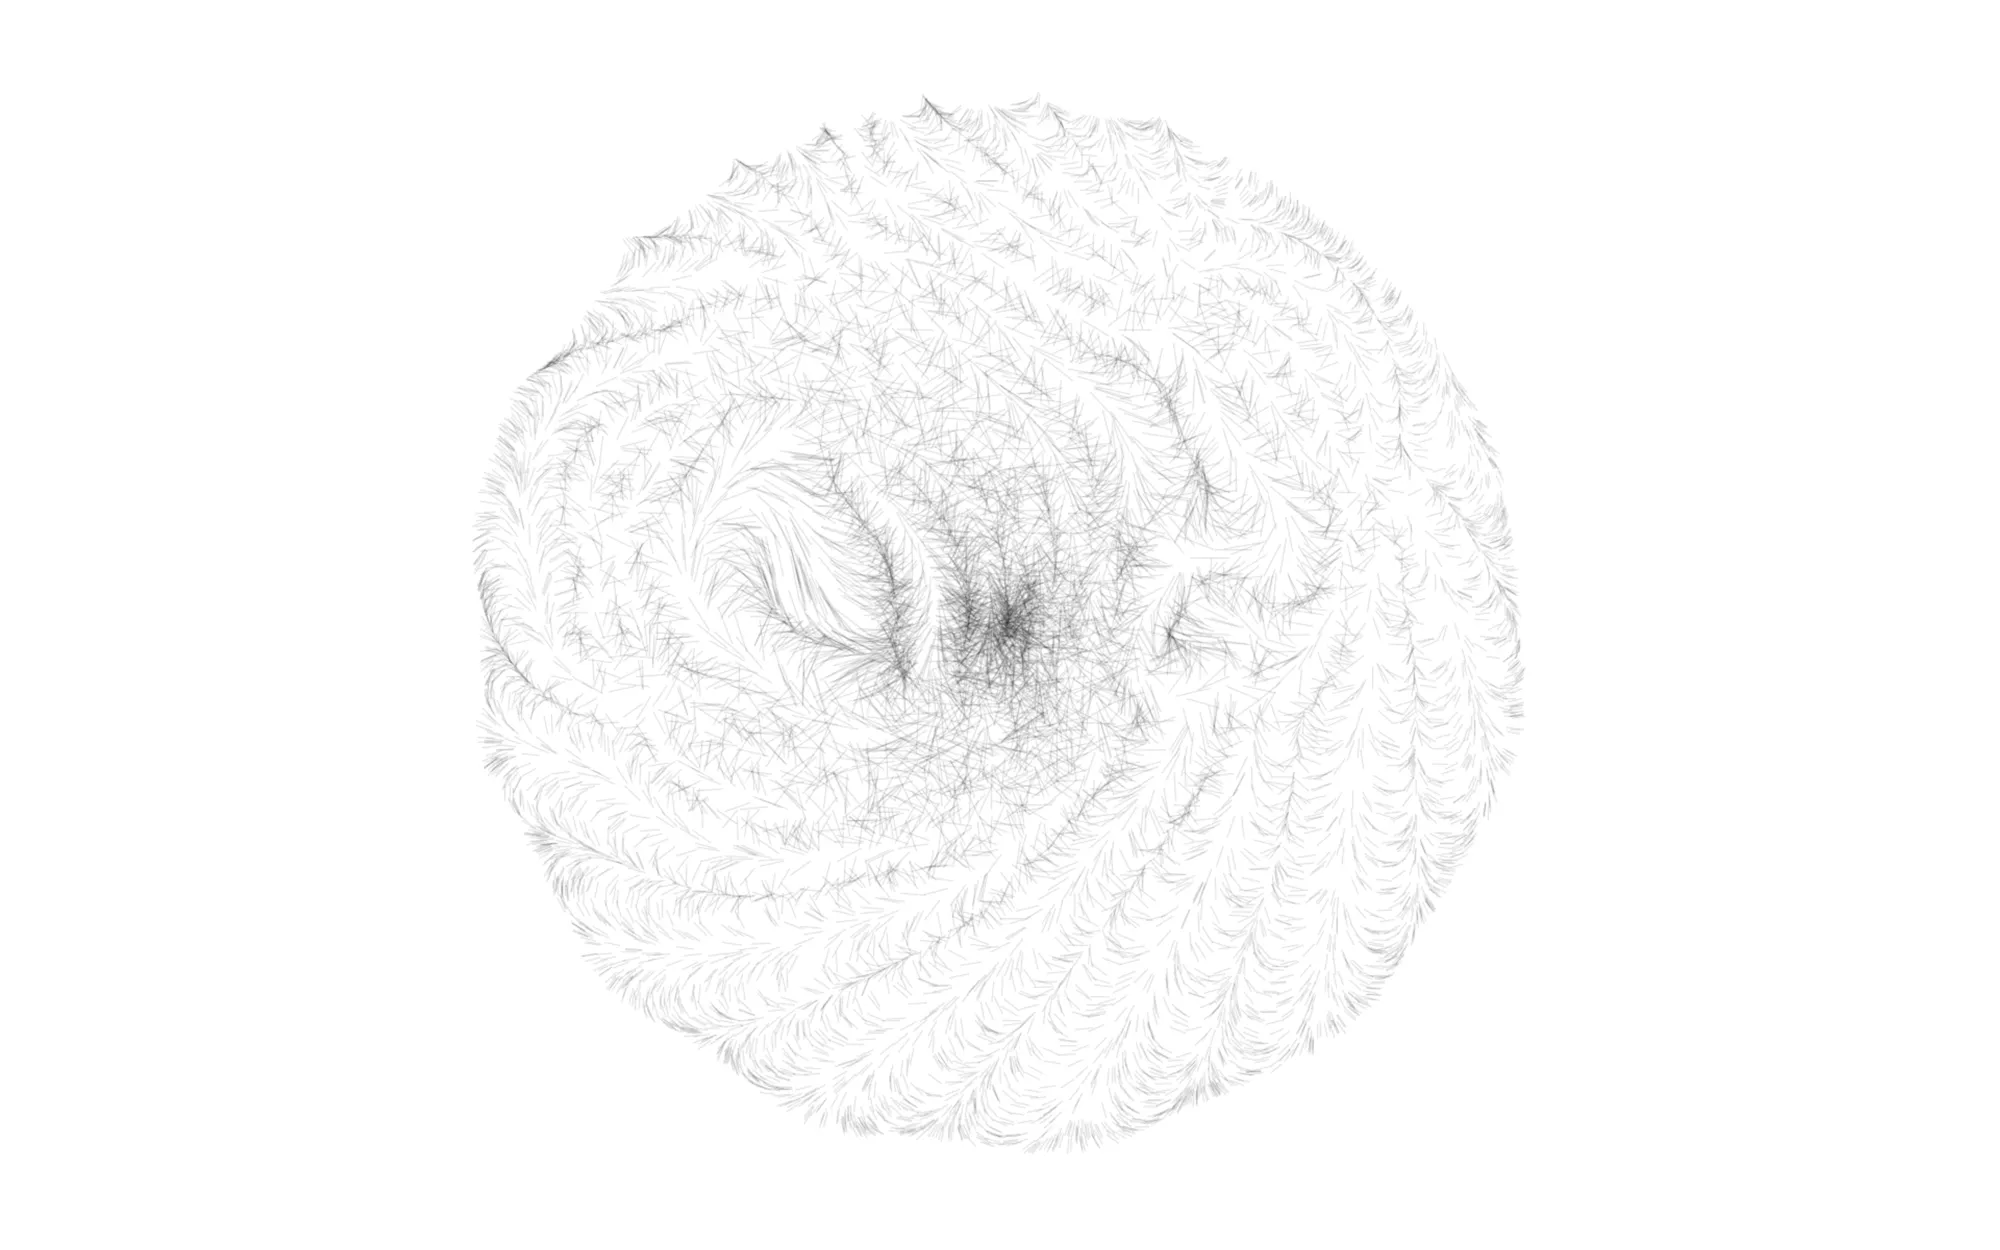
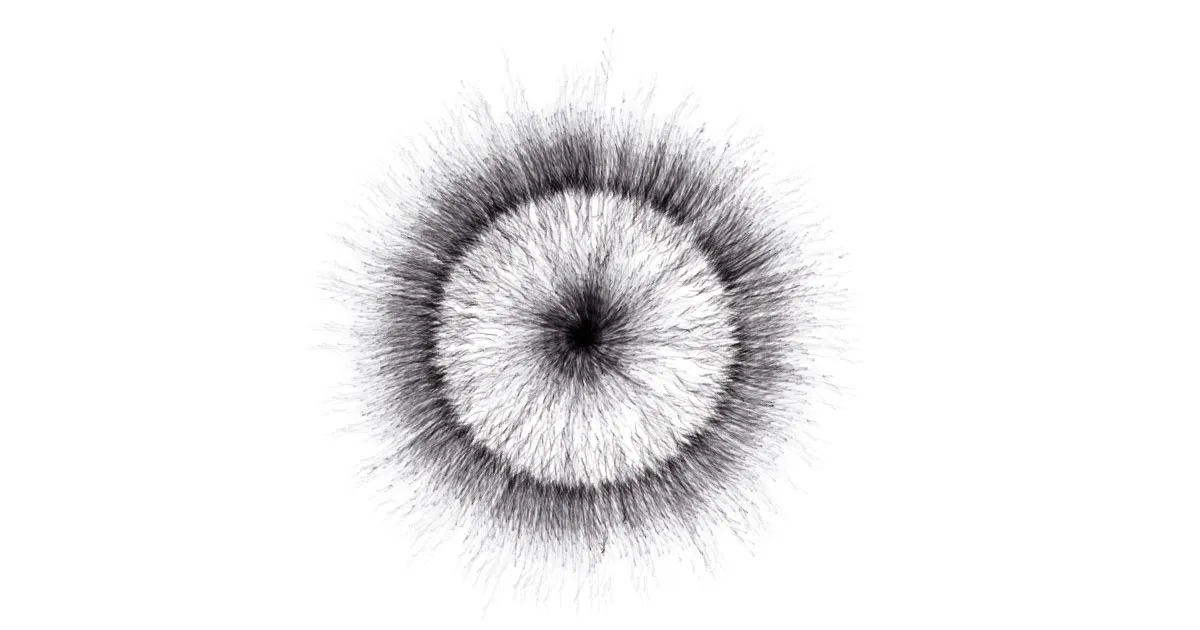
A translation of Jared Tarbell's hypnotic "Binary Ring" from Processing to JavaScript. At first I thought this might be too much for the 2d canvas renderer. Yet it seems to work just fine. I really like Tarbell's work and since he shares the source code, I am going to do a few more of these to learn how he gets all those organic images. See his work at complexification.net.

Now Loop

Wednesday, September 2, 2015

Draw a line connecting the current year-month-day-hour-minute-second-millisecond. Aided by code, it is possible to animate in the "now", what does this mean for animation?. This sketch is a starting point for considering not only "real-time" animation, but (perhaps more interesting), explore that ephemeral state in flux where all that one has accumulated in life suddenly has a chance to act upon oneself, the rational mind has no time to consider anymore, the "now" is like an epic collision of all that we are, yet it manifests itself organized, mundane, often irrelevant.

Pulse Analysis

Saturday, August 1, 2015

Visualization to aid the parsing, cleaning and analysis of pulse data.

Pulsescape A

Tuesday, October 21, 2014

Variation of the pulse data visualization.

Facebook Network

Tuesday, September 2, 2014

Abstraction of my Facebook network of friends, each person is represented by a node and its properties vary depending on how it is related to the others in the network. Built using the D3.js library.

Pulsescape

Thursday, July 17, 2014

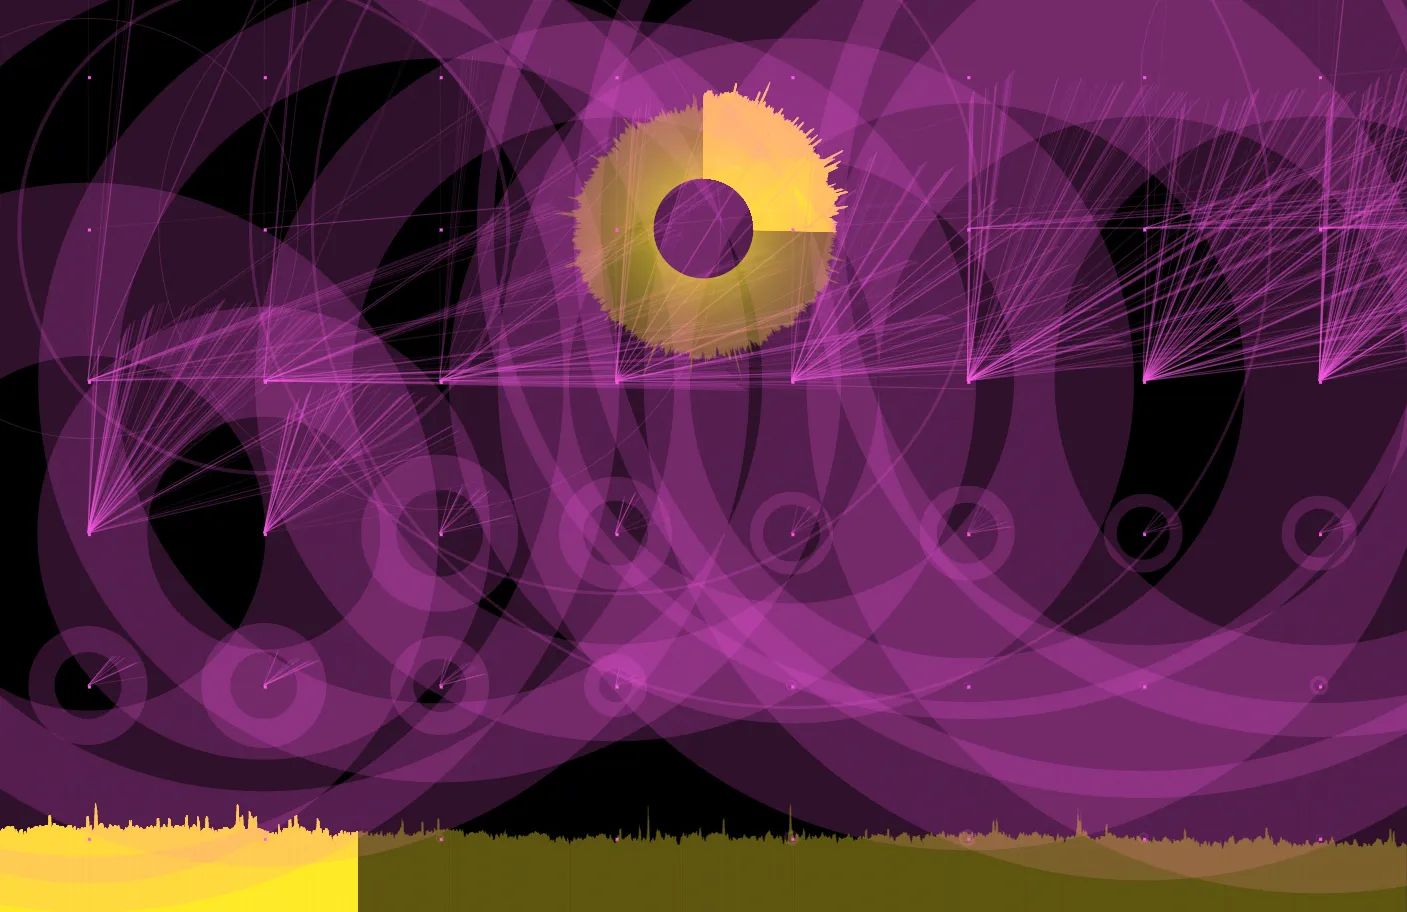
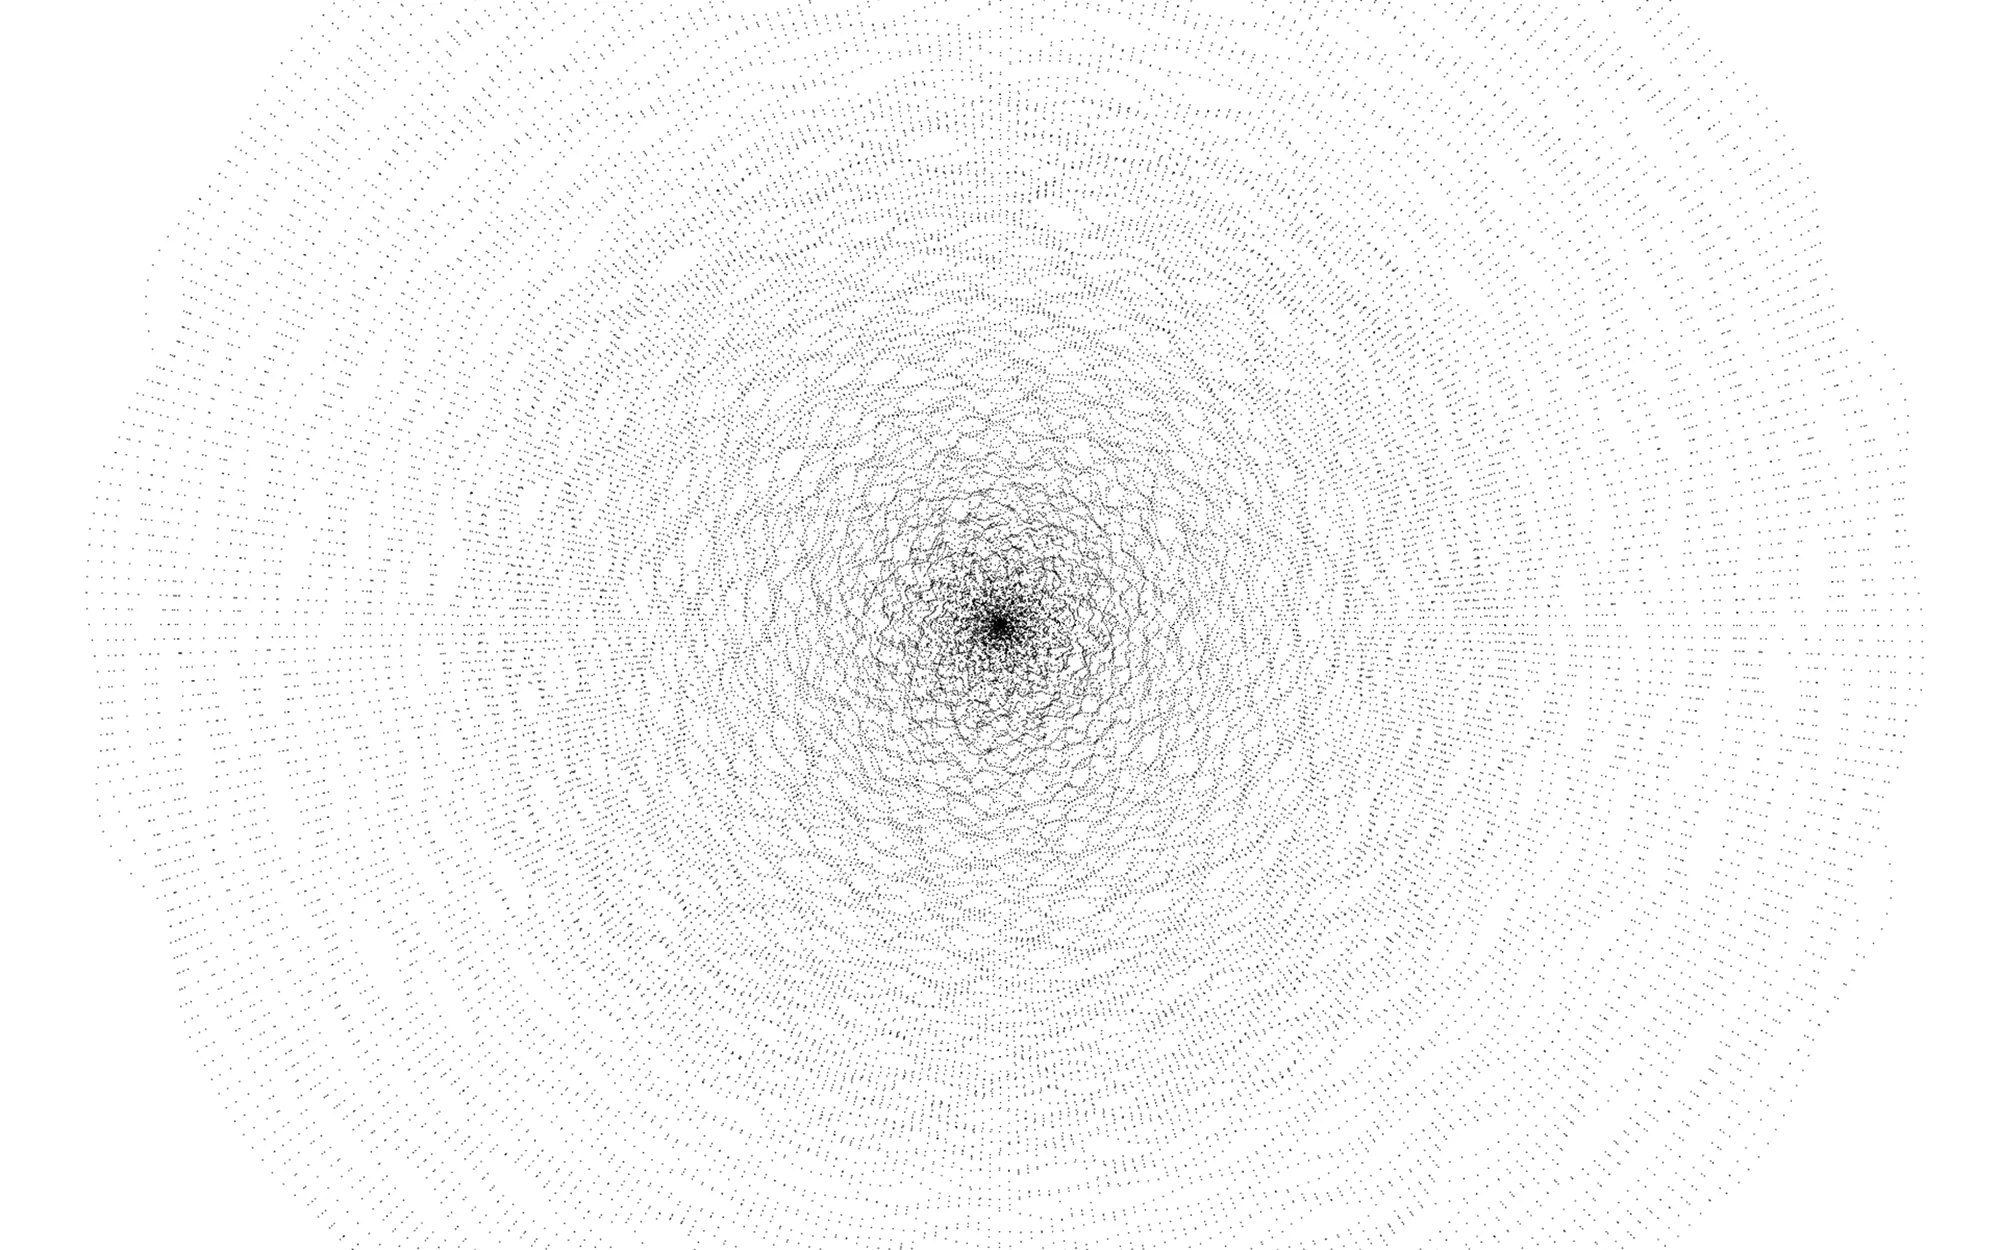
A visualization of my pulse while reading one of my father's writing.

Circle Variations

Monday, July 7, 2014

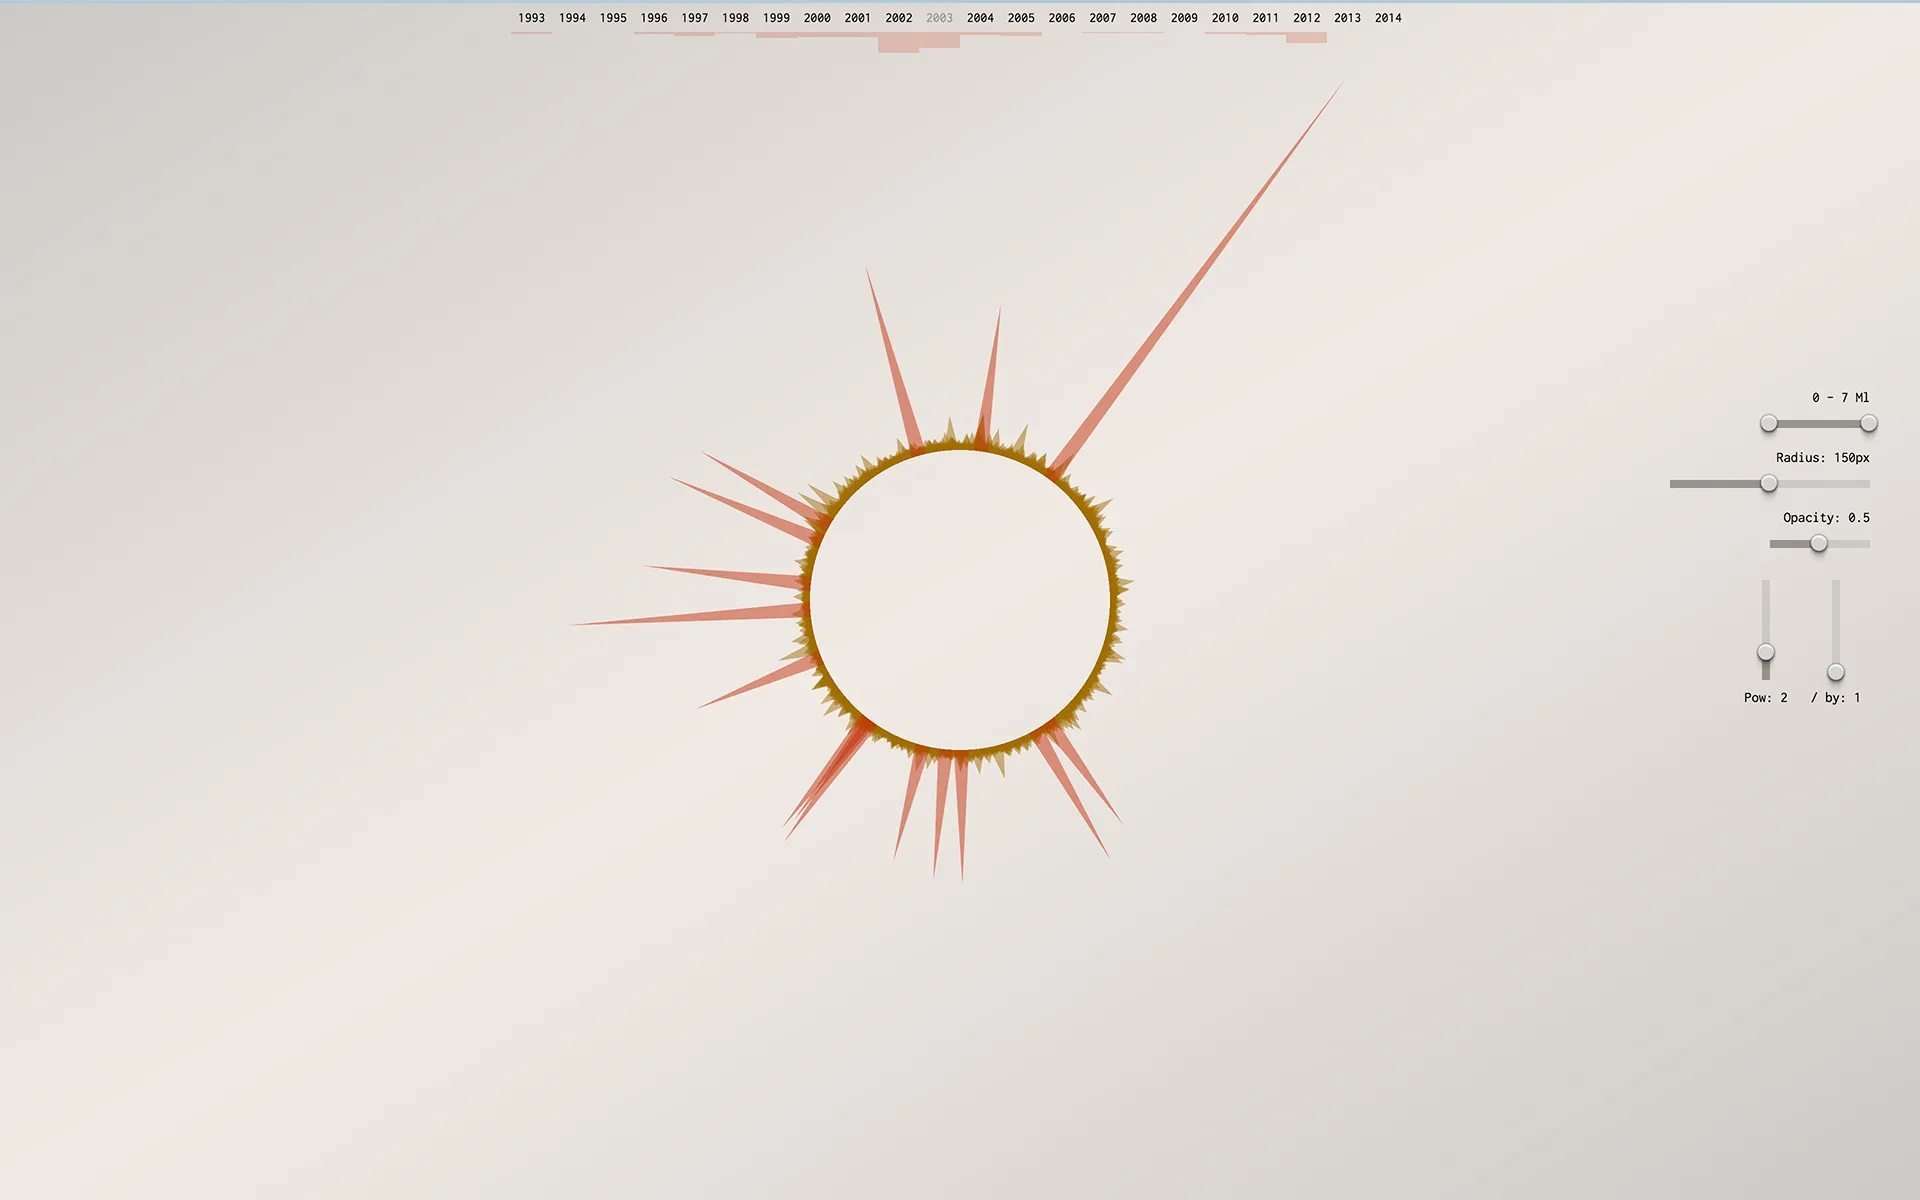
A collections of interactive drawings representing seismic activity in Colombia. Each stroke of the drawing is defined by the seismic data over a year.

Spikes

Sunday, June 15, 2014
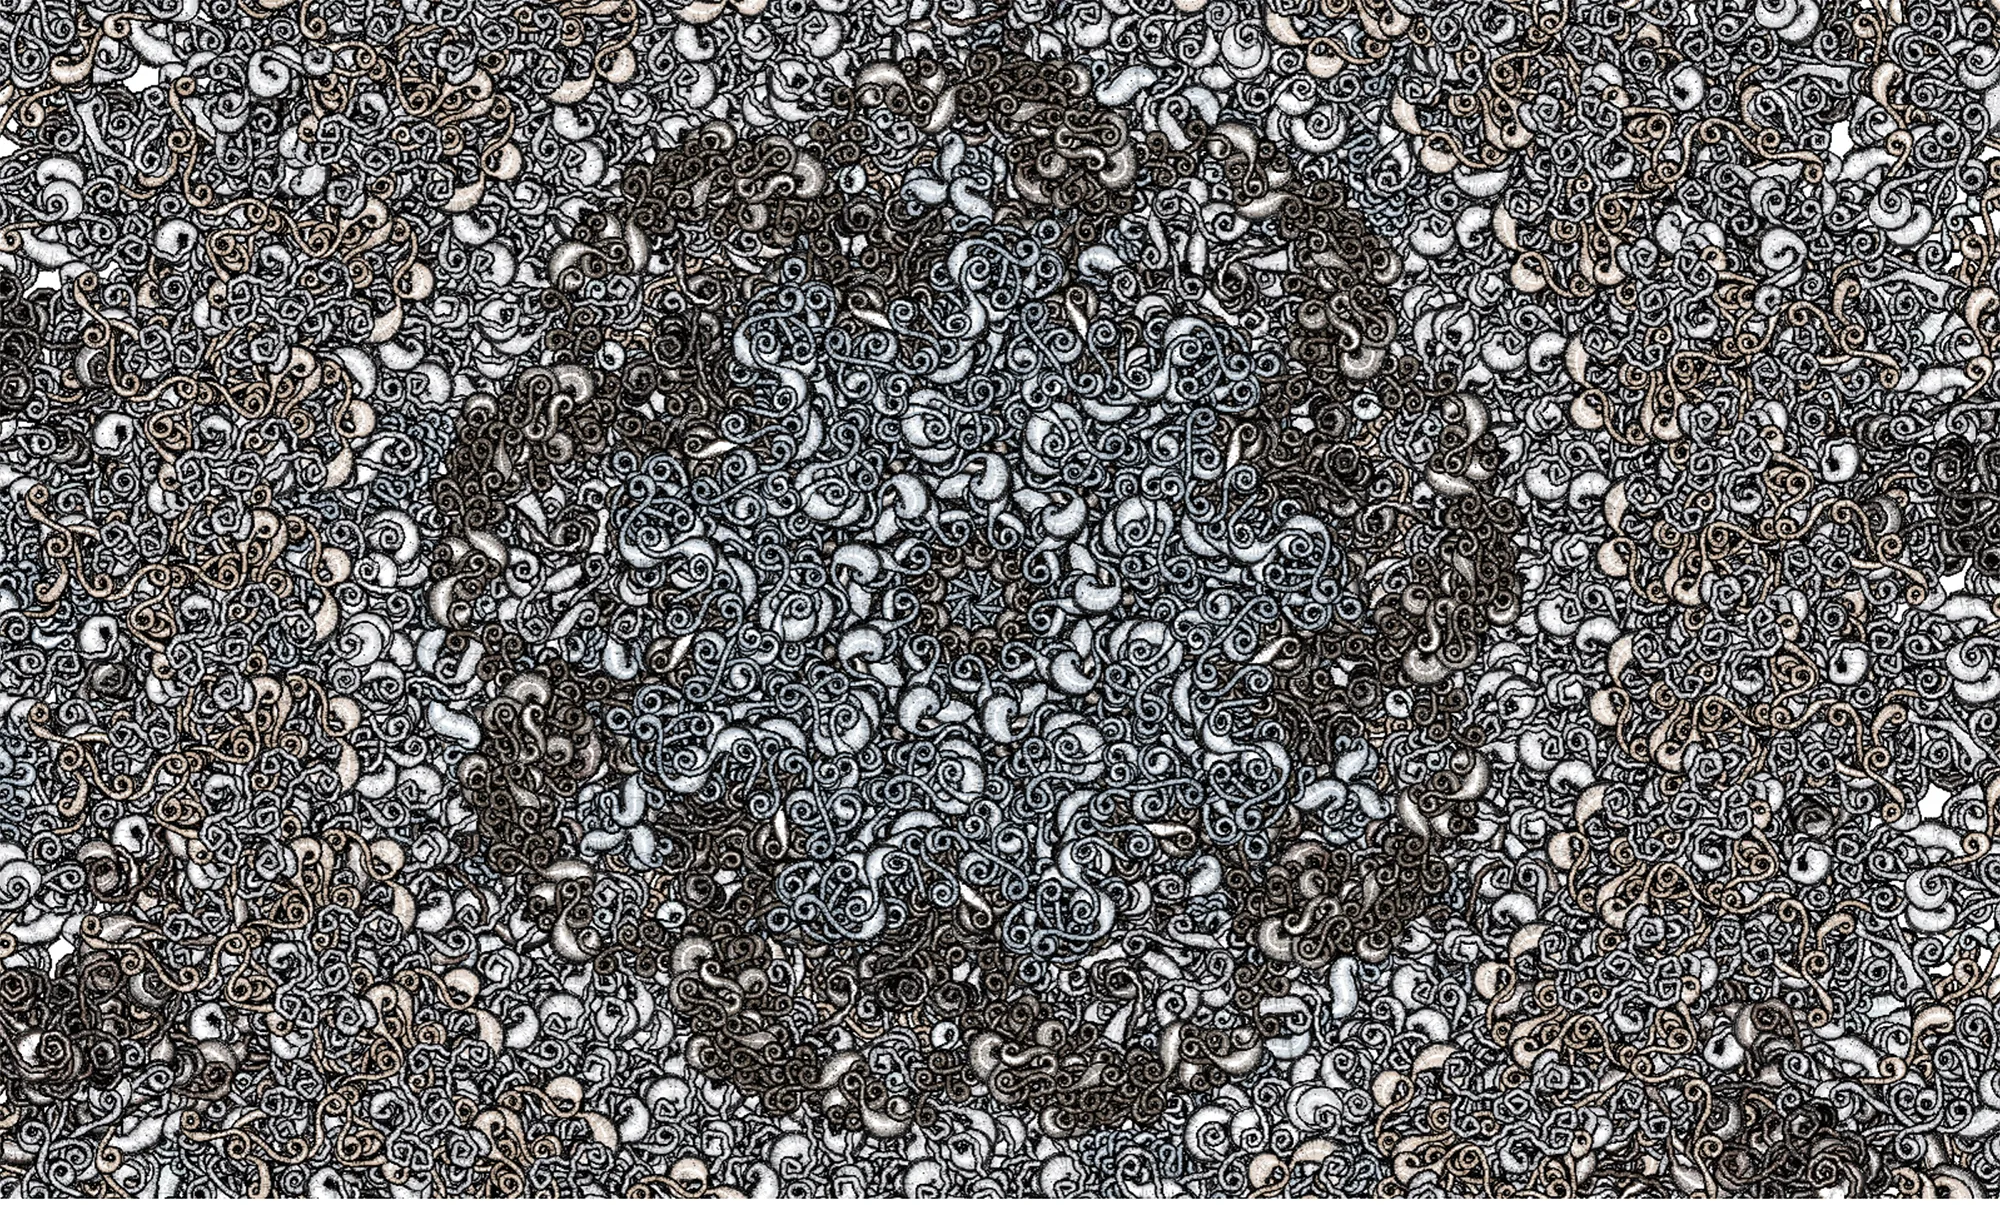
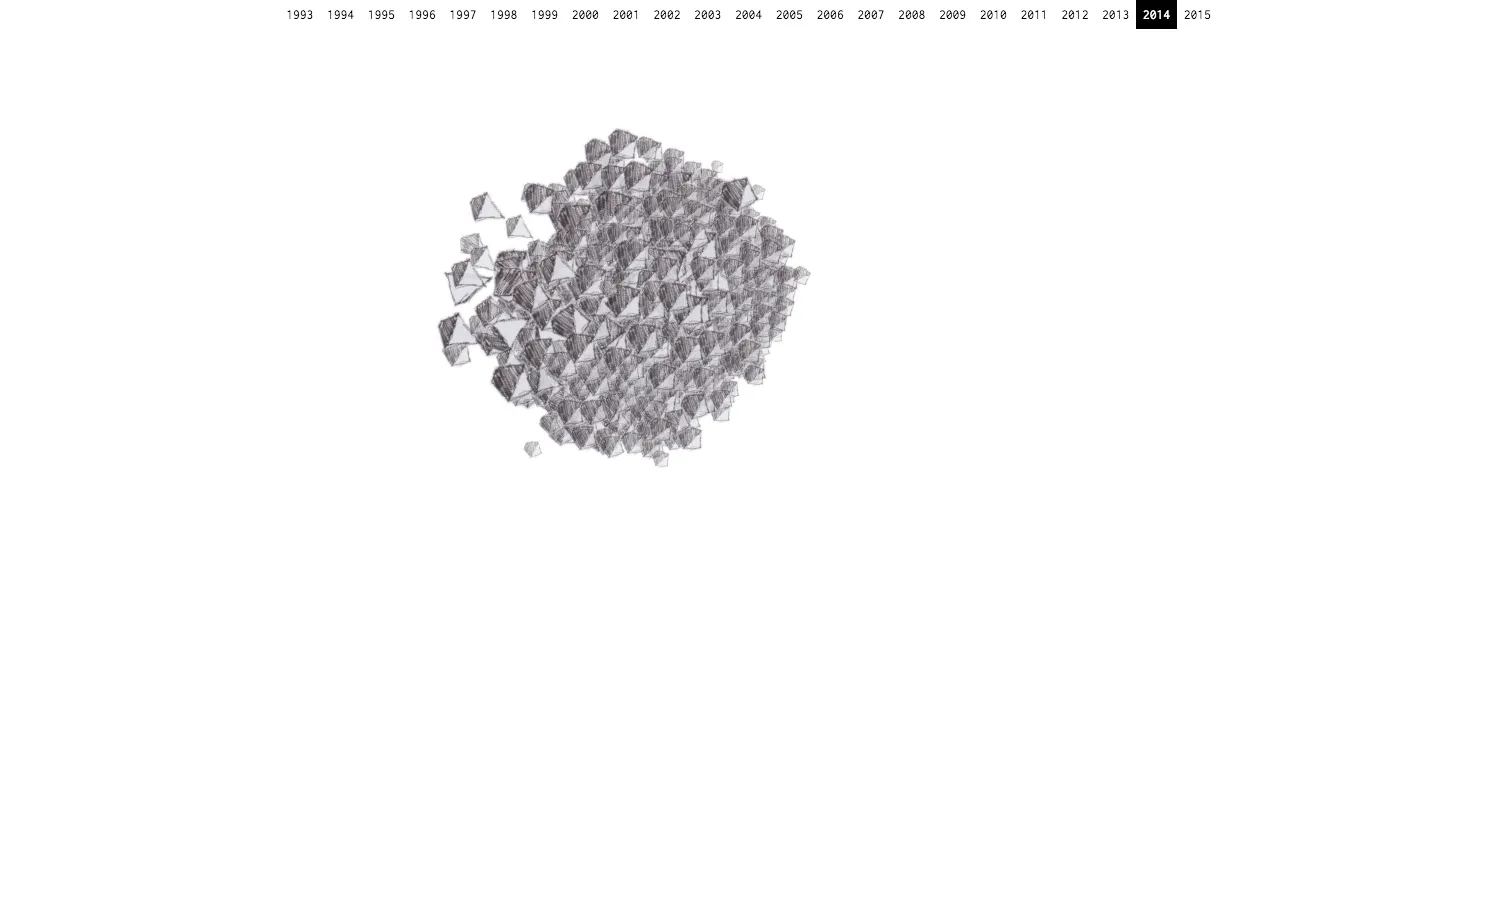
Notations of seismic activity and terrorist attacks in Colombia with data from 'Ingeominas' and 'Centro de Memoria Histórica'. SVG visualization using D3.js.

Flock

Friday, May 23, 2014

Danger is coming.

Tireless Feathers

Wednesday, May 7, 2014

An inquisitive bird follows the pointer in front of him.